How to access to Pega alert logs in Pega Cloud
Collecting Logs Takes Time
One of the time-consuming activities that every engineer has to contend with to diagnose issues is getting the logs. Often a single log is not enough since most clients run multi-node clusters. Gathering multiple logs and finding the issue takes time. The Diagnostic Services team understands this and has already done that work for you for the Pega alert logs.
How the Diagnostic Services Team Can Help!
The Pega alert logs are captured in near real-time, consolidated and even interpreted making the job of diagnosis much easier. Having all the alert logs in a single place eliminates that time and lets you focus on client success. You can find this information in PDC. Every client of Pega Cloud has their alerts logs for every cluster already available for you in PDC. No work needed. You may have the same information from Client Cloud systems as well. Those systems must opt-in, so you may not have them all. If you get the chance, encourage the client to enable PDC. It is included in their Pega Platform license and can make everyone's lives much easier.
How to Quickly Look at Alerts in Pega Cloud
Let’s look at how simple it is to look at alerts in the Cloud.
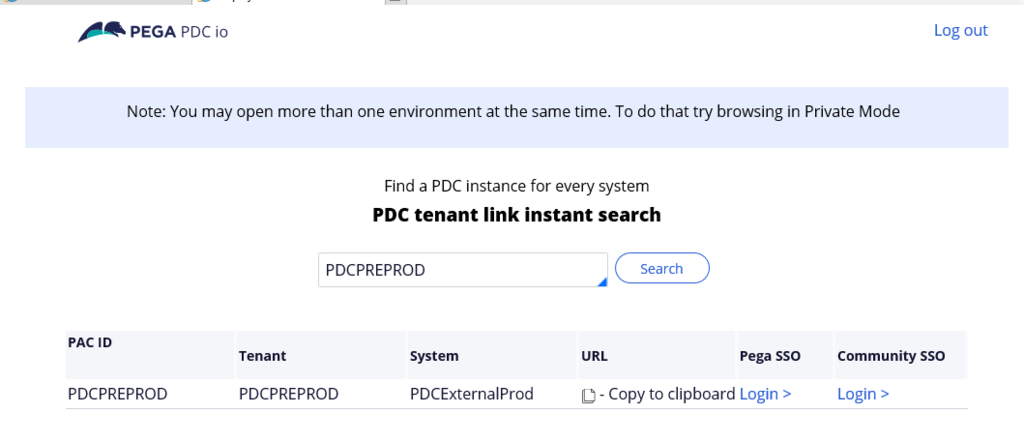
First, we need to find the PDC tenant for the client. The easiest way is to use the lookup function. If you are already familiar with the tenant lookup service, just skip ahead. There are no quiz questions on it.
The URL
https://pdc-central.pegacloud.io/prweb/sso/gkm6sii_CyRi1ldu--WpS95js7Jvi-ti*/!STANDARD
From here you can find the PDC that is for a given client. Some clients have more than one PDC tenant, so don't be surprised. Always select the Pega SSO link. That link will allow you to use your Pega credentials. Just a note, there are a small number of clients that have restricted access.
Once you sign into the PDC tenant, you will be greeted by the following screen. The arrow is pointing you to the Event Viewer, which provides access to the alerts logs. PDC gets new releases every week, so don't be concerned if the UI is a bit different. The Event Viewer is the selection you want.
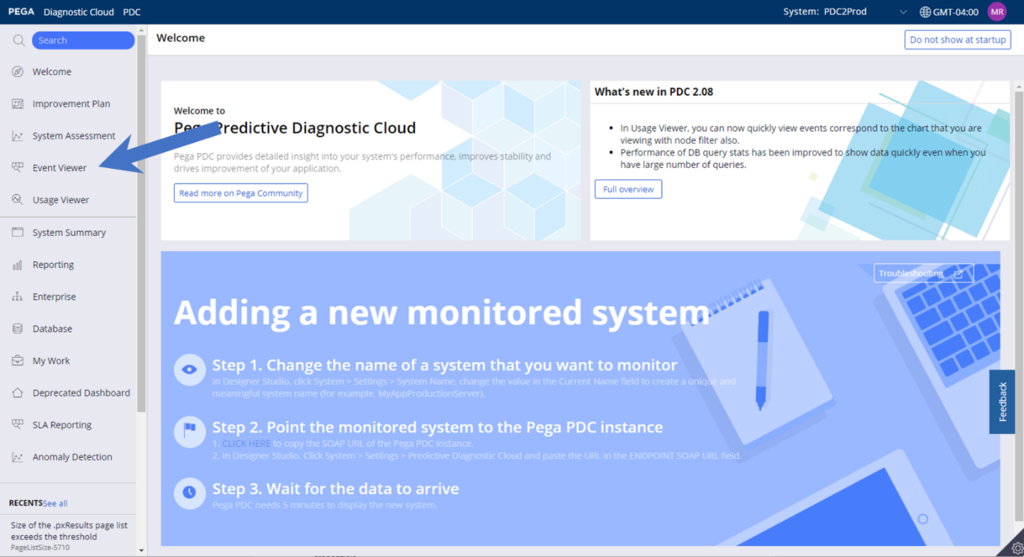
There are a few things to note on this screen. In the upper-right, there are two options. The first option allows you to select the system. The default is a production system. Most tenants have more than one system. Make sure you are looking at the correct one. The second option is time zone. You can change the time zone to reflect the time zone of the client. No conversions necessary, PDC does that work automatically for you.
Selecting the event viewer link brings you to the live stream of events for the system. Below you can find an example.
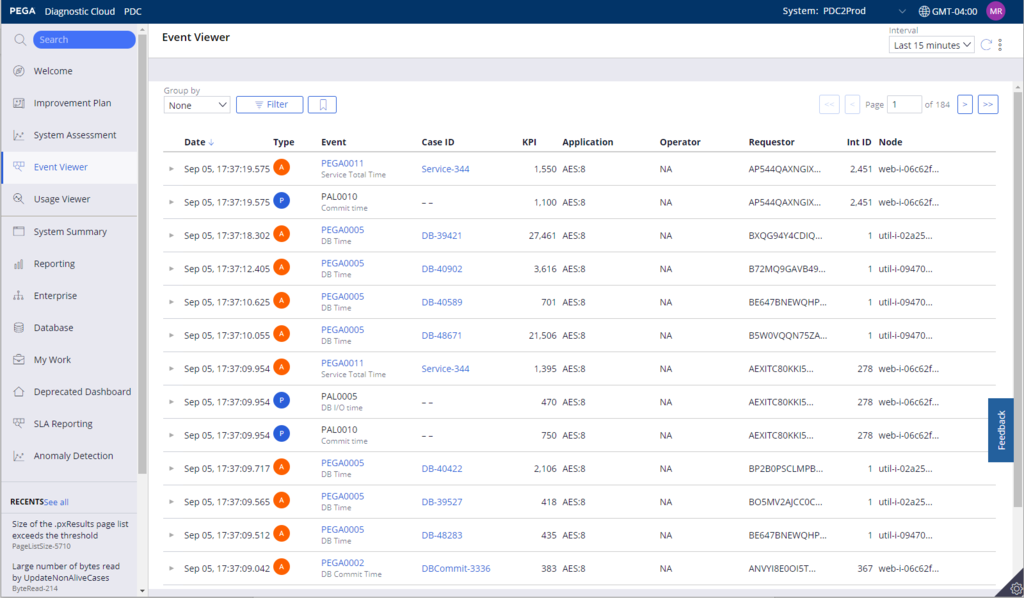
When you open the event viewer, some things you will immediately recognize. Alerts like the SQL query time (PEGA0005) are found here just as you would find in the alert log. To make your job easier, PDC has already interpreted the Alerts and may generate additional events to reflect that insight. PAL* and OPS* events are examples. Check them out as they can save you time. Also, PDC has already aggregated symptoms together. You see them represented by the cases. One case may reflect many alerts.
Many of you use Excel to process the alert log. Grouping, sorting, and filtering are common functions used when in Excel. All of that is available right from this screen. Simply use the menus on the upper left.
The PDC event viewer is a single place to understand what is happening in a system. It allows you to see the alerts but also other events that are important for your work. For example, if a client Elasticsearch index shrinks dramatically, something is likely wrong. PDC notices that situation and generates an event which you see in the Event viewer. The Pega log is not here … yet. Stay tuned.
Send us your Feedback
The PDC mission is to make your life easy and your improvement feedback is a critical component of this mission. Please visit the Building Bridges application to submit and vote on PDC improvement ideas. The PDC team reviews this regularly and is actively pulling these ideas into their sprints.
If you are having problems with your training, please review the Pega Academy Support FAQs.
Want to help us improve this content?