
Pega Platform analytical tools
Pega Platform tools to use in each sprint
Pega Platform™ includes several built-in validation tools and dashboards to provide a holistic view of the application's health. These allow you to quickly analyze where improvements can be made, and ensure your application adheres to the Definition of Done (DoD) defined during the Prepare phase.
- Pega Predictive Diagnostic Cloud™ (PDC) – AI-powered technology that is used throughout the application life cycle to assess the health of your application
- Performance Profiler – Identifies which part of the process might be having performance issues
- Database Trace – Validates the performance of your application's interactions with the Pega database or other relational databases
- Performance Analyzer (PAL) – Provides a view of all the performance statistics that Pega Platform captures
The tools pinpoint problem areas and, in some cases, identify ways to mitigate or fix the issues. Using these tools throughout the project life cycle, you identify potential performance, security, and stability issues earlier in the project. Because application issues are often tied to architecture and design, they must be found and rectified as soon as possible, when it is significantly easier and less expensive to resolve.
Tip: Incorporate Pega tools into your in-sprint testing. Include these within your formal Definition of Done (DoD) to ensure they are used.
Application performance analysis with PDC
Pega Predictive Diagnostic Cloud™ (PDC) is an AI-powered technology used throughout the application life cycle to assess your application's health, notify you of critical issues, and resolve performance, security, and stability problems.
PDC gathers, aggregates, and analyzes alerts, system health pulses, and guardrail violations generated from Pega Platform applications to produce trending dashboards. PDC empowers business stakeholders and IT administrators to take preventative action by predicting potential system performance and business logic issues and providing remediation suggestions.
PDC identifies and helps you resolve issues like:
- Application logic – Issues related to the configuration used to incorporate the business logic in your application
- Connectors – Issues related to the connectors in your application
- Database – Issues that occur in your database configuration
- Decisioning – Issues related to Decision Strategy Manager (DSM)
- Exceptions – Issues related to errors in the code
- Operations – Issues related to the run-time operation of your application
- Pega Platform tuning – Issues related to your configuration
- Event-related – Data points that PDC receives from the systems that it monitors
PDC events include alerts and exceptions, it:
- Checks whether your system encountered any exceptions (unplanned events that interrupt the flow of a running program)
- Investigates events that preceded system failure
- Evaluates the circumstances of an issue:
- Investigates events that coincided with diminished performance to find areas for improvement
- Assesses whether a node that has affected performance is running correctly
For more information about accessing and using PDC, see the Pega Academy topic Analyzing application performance with PDC.
Application performance analysis with Performance Profiler
The Performance Profiler determines which part of the process might have performance issues, or identifies the particular step of a data transform or activity that might have a performance issue. When you use the Performance Profiler, you first record readings of the application's performance and analyze the readings to identify problems.
To learn more about the Performance Profiler landing page, see the Pega Academy topic Analyzing application performance with Performance Profiler.
Application performance analysis with Database Trace
The Database Trace produces a text file containing the SQL statements, rule cache hit statistics, timings, and other data that reflect the interactions of your requestor session with the Pega Platform™ database or other relational databases. Familiarity with SQL is not required to interpret the output.
For more information about the Database Trace, see the Pega Academy topic Analyzing application performance with Database Trace.
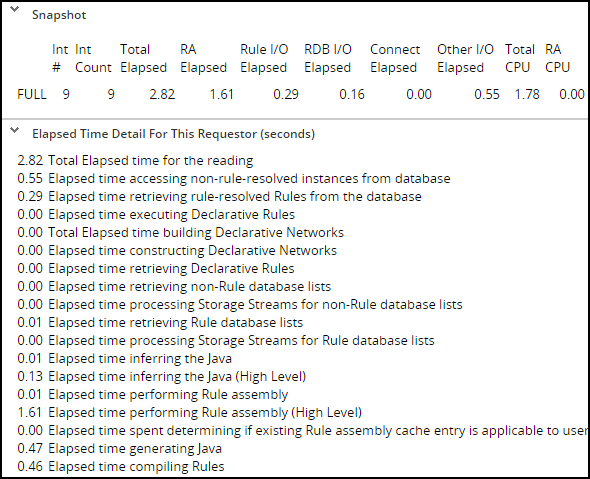
Application performance analysis with the Performance Analyzer
The Performance Analyzer (PAL) provides a view of all the performance statistics that Pega Platform captures. You can use PAL to understand the system resources consumed by processing a single requestor session.
For more information about Performance Analyzer, see the Pega Academy topic Analyzing application performance with the Performance Analyzer.
Check your knowledge with the following interaction.
This Topic is available in the following Module:
If you are having problems with your training, please review the Pega Academy Support FAQs.
Want to help us improve this content?