Debugging Constellation applications
8 Tasks
1 hr 15 mins
Intermediate
User Experience
Constellation
Low-Code App Development
English
Scenario
Due to the stateless nature of a Constellation application, it is not possible to run the Pega Clipboard from the user Portal, or from Dev Studio and then switch the thread to investigate live data. As a result, it is important to become comfortable debugging Constellation applications using the Tracer tool, as well as your browser's DevTools.
Note: DevTools are programs that are included with your browser that enable you to create, test, and debug software. With the Chrome, Edge, and Firefox browsers, you can access the DevTools by pressing F12 on your keyboard.
The following table provides the credentials you need to complete the challenge:
| Role | User name | Password |
|---|---|---|
| System Architect | Author@SL | pega123! |
Note: Your practice environment may support the completion of multiple challenges. As a result, the configuration shown in the challenge walkthrough may not match your environment exactly.
Challenge Walkthrough
Detailed Tasks
1 Access View JSON data in Dev Studio
- In the Pega instance for the challenge, enter the following credentials:
- In the User name field, enter Author@SL.
- In the Password field, enter pega123!
- In the navigation pane of App Studio, click Case Types > Incident to open the Incident Case Type.
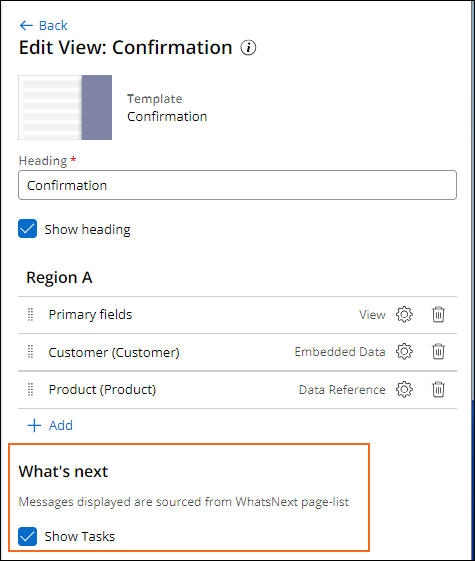
- On the Case Types UX tab, navigate to the Confirmation partial View.
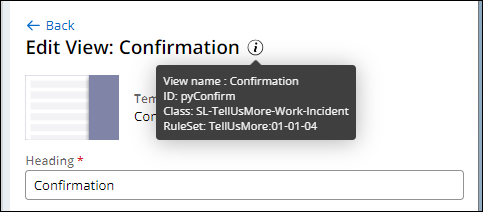
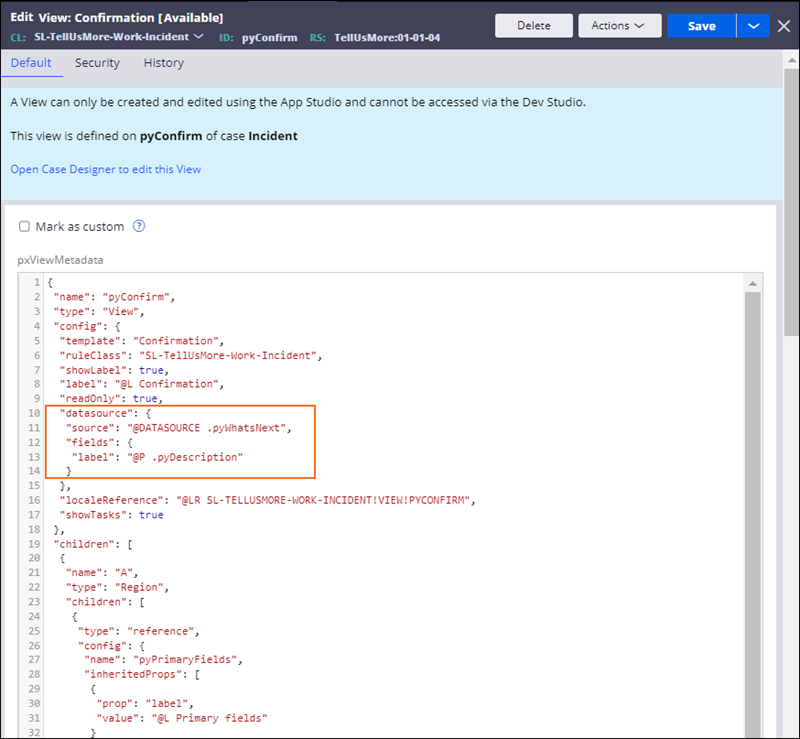
Note: Pega provides several out-of-the-box Views that can be used in developing Case Types. Some of these Views have unusual configurations. An example of this is the Confirmation View (ID: pyConfirm). This View is responsible for displaying information in the Assignment confirmation.
- Hover over the Information icon to see the View's metadata.
- Note the What's next section of the Confirmation View.
- Switch to Dev Studio.
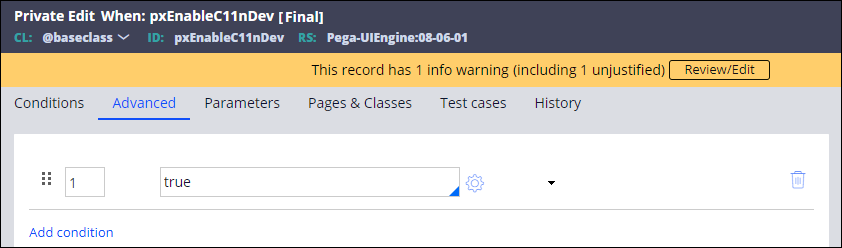
- Search for the Rule named pxEnableC11nDev. If the Rule cannot be found in the search menu of Dev Studio, click and filter the Name column by pxEnableC11nDev to locate the Rule.
- Open the pxEnableC11nDev Rule, continue with a , and then set the value equal to true.
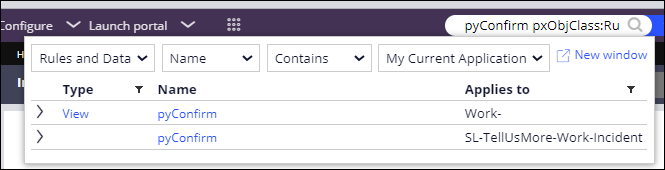
- In the Search bar of Dev Studio, enter pyConfirm pxObjClass:Rule-UI-View to open the pyConfirm View.
- Select the pyConfirm View Rule associated with the SL-TellUsMore-Work-Incident class.
- In the JSON, find the reference to .pyWhatsNext and check which property is taken and displayed on the UI.
2 Create a Research Case Type
- Switch to App Studio, and in the navigation pane, click .
- Create a new Case Type named Research.
- The Research Case Type should have two additional Stages: Debug and Resolve.
- In the Resolve Stage contextual properties pane, select Resolve the Case.
- In the Debug Stage, create a Collect information Step labeled Debug.
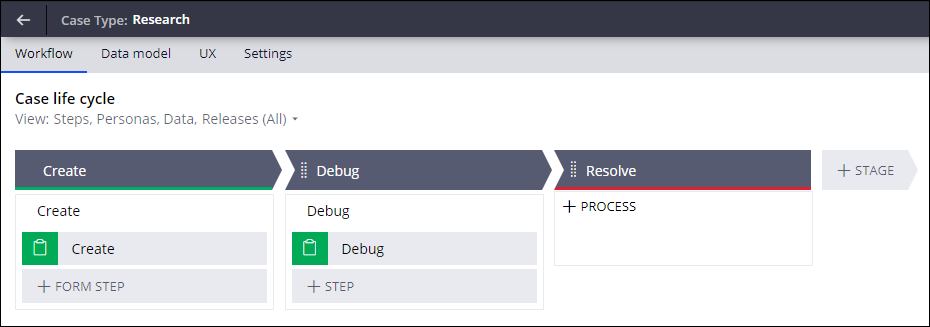
- Click Save.
3 Examine View Rules using the Tracer
- In the Research Case Type, open the Case Type Data Model.
- Add a new Address field named Address.
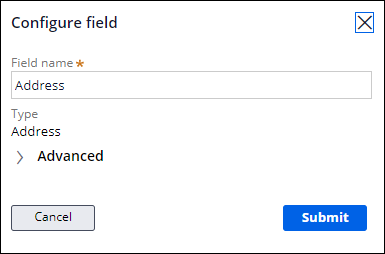 Note: By default, the Address Field Type has a default View named pyAddressForm.
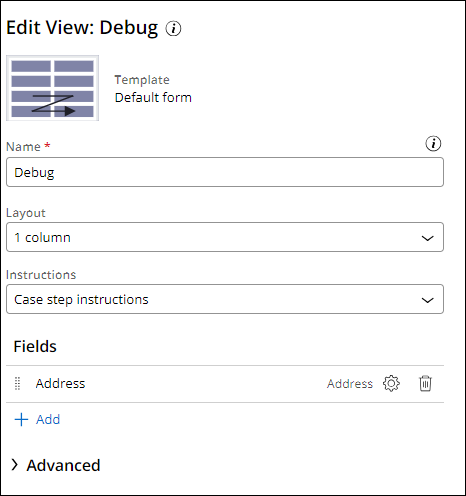
 - From the Debug Step, open the Debug View, and add the Address field to it.
- Click , then .
- Click the button to open the Portal window.
- Create a Research Case Type. In the Create-Research View, click .
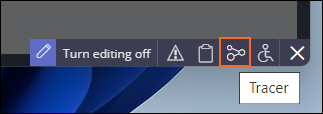
- In the bottom-right corner of App Studio, open the Tracer.
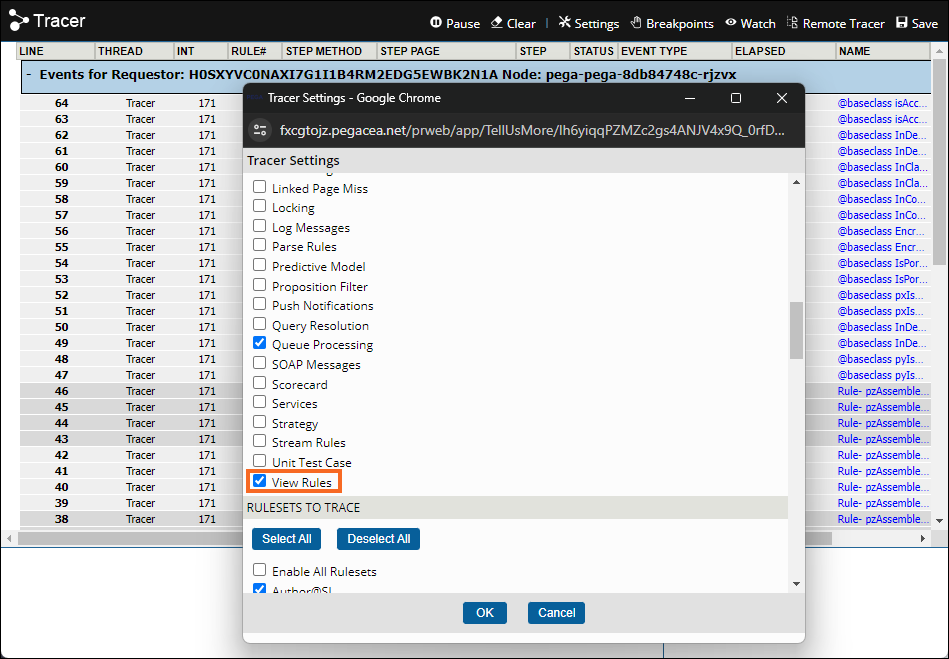
- Click Settings. In the EVENT TYPES TO TRACE section, scroll down and enable the View Rules. Then click .
- Navigate back to the Portal and the Debug Assignment.
- Navigate back to the Tracer, expand Resource: /application/v2/assignments and search for View Start to locate the name of all the Views requested for rendering.
- Find the Views associated with the pyAddressForm.
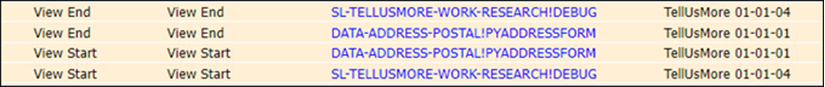
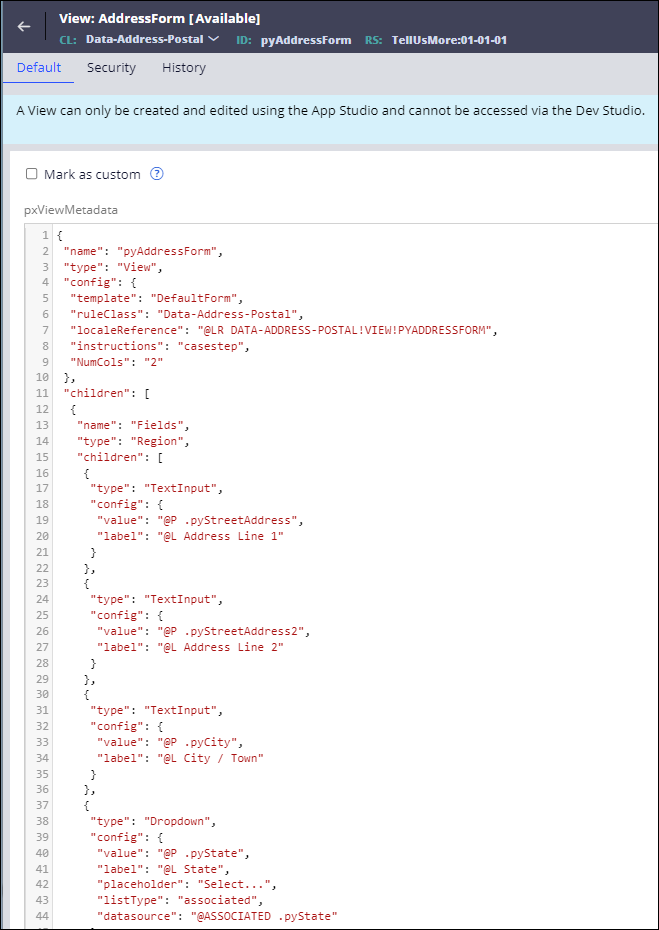
- Click the DATA-ADDRESS-POSTAL!PYADDRESSFORM link to open the JSON for the AddressForm View.
- Close the Tracer tool.
4 Explore View metadata with X-Ray
Note: The X-Ray tool provides an intuitive way to debug screen issues, such as metadata, fields metadata, and state properties. X-Ray is primarily used for debugging Views and other UI controls, rather than Assignments.
- In App Studio, open the Research Case Type.
- Click the UX tab, and open the Details partial View.
- Delete the Primary fields View and add the Address field to the Details partial View.
- Switch to Dev Studio, and the Customer Portal.
- Create a new Research Case.
- Navigate to the Debug Assignment.
- Open the Dev Tools for your browser - likely using F12 ( for Chrome, Fire Fox, Edge)
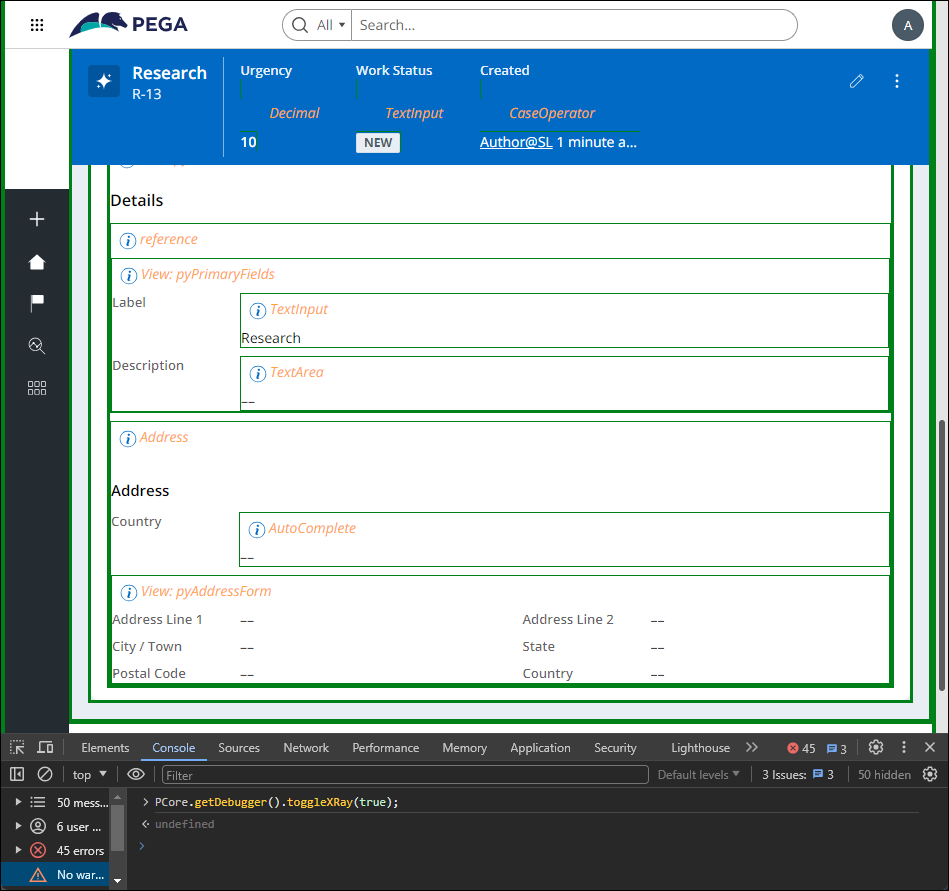
- Navigate to the Console tab and clear the window.
- In the Dev Tools Console, enter: PCore.getDebugger().toggleXRay(true); to start the X-Ray tool.
Note: If you see the following message: PCore is not defined in the Console, it is probable that you launched the Portal from App Studio. The PCore and PConnect methods are not available in the App Studio shell. For PCore and PConnect to work, you must launch the Portal from Dev Studio.
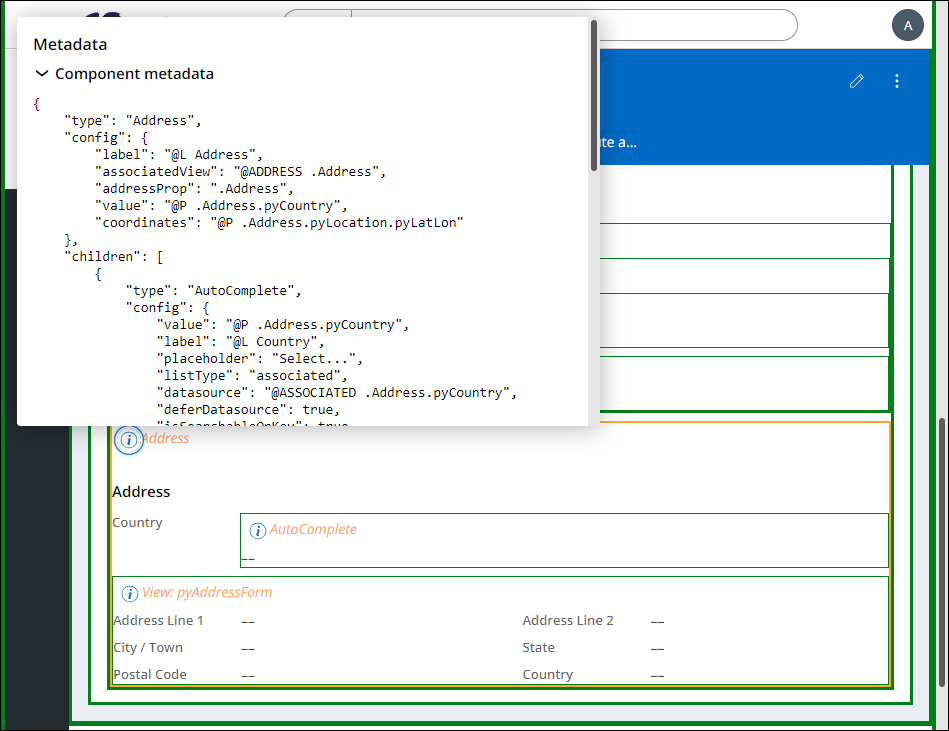
- Navigate to the Details, tab and then find the partial View that is related to the Address property.
- Click the Information icon next to the Address section to find the metadata related to the Address property.
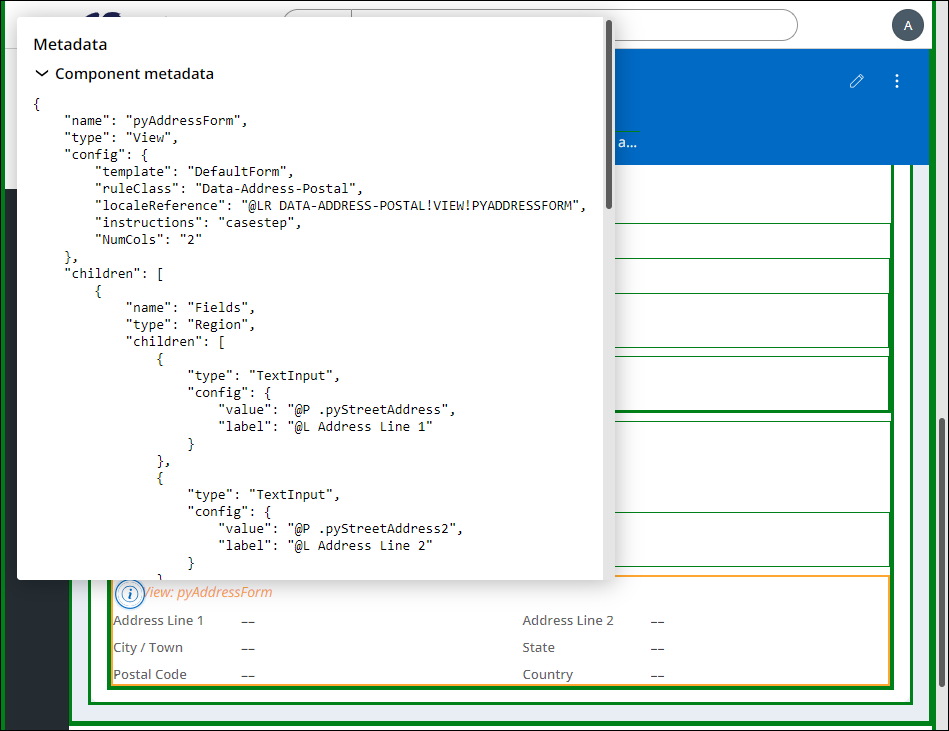
- Click the Information icon next to the View:pyAddressForm section to find the metadata related to the View.
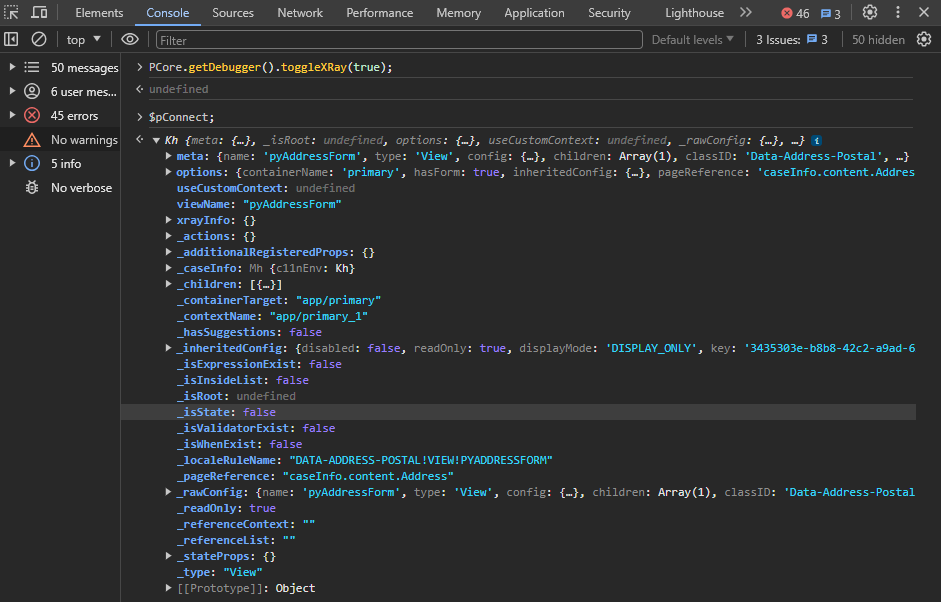
- Navigate back to the Console and enter $pConnect;
- Explore the information provided in the Console related to the pyAddressForm View.
- To stop the X-Ray tool, enter PCore.getDebugger().toggleXRay(false);
5 Examine the App Announcement Section of the Portal Home Page
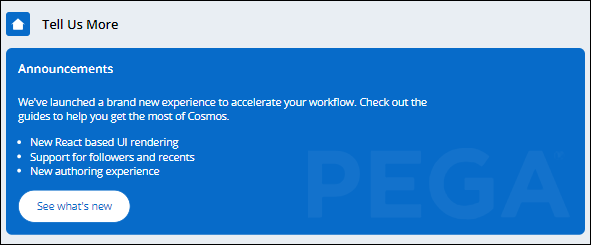
- In the Customer Portal, navigate to the Portal Home page.
- Note the contents in the Announcements banner.
- Enable your Dev Tools (F12), and in the Console, enter PCore.getDebugger().toggleXRay(true);
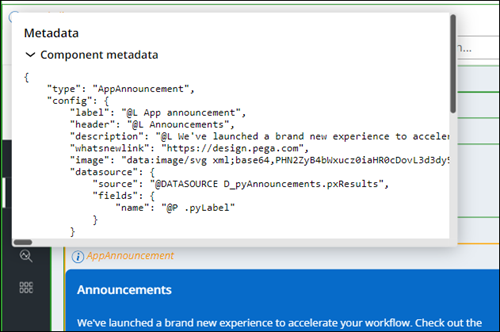
- Investigate the metadata for the Views associated with the Tell Us More announcements, including:
- View: pyHome
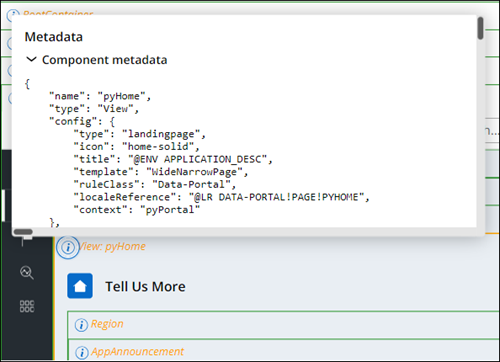
- AppAnnouncement
- View: pyHome
- Switch back to Dev Studio.
- Using the App explorer, enter Rule-UI-View.
- From the list of Views, open the pyHome View and review the JSON data.
- Note that the datasource for the pyHome Announcements information is driven by the D_pyAnnouncements Data Page.
- Using the Dev Studio Search bar, open the D_pyAnnouncements Data Page.
- In the Data Sources section, open the pyInitAnnouncements Data Transform.
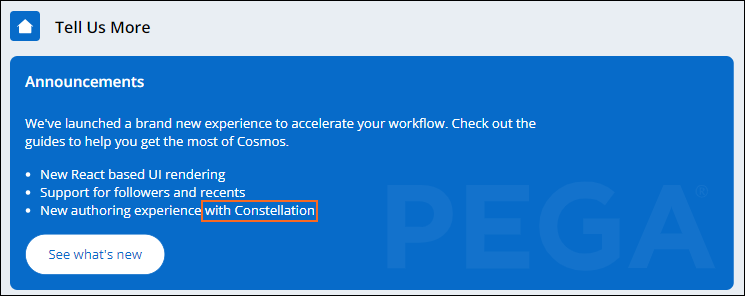
- In line 3.1, update the text in the Source field to read New authoring experience with Constellation
- Launch a new instance of the Customer Portal. On the Home page, note that the third bullet point is updated.
6 Debug DX API calls
Note: You can collect more details about the request and response of your DX API with the DebugPegaAPI system setting. When you set the DebugPegaAPI to true, your system captures information about API errors in the PEGA log. The DebugPegaAPI system setting is particularly useful for debugging page instructions and field security errors.
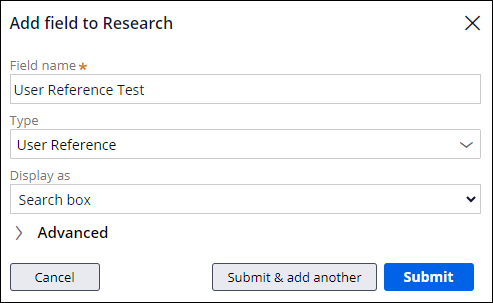
- Switch back to App Studio. In the Research Case Type Data Model, create a field named User Reference Test with a Type of User reference.
- Add the User Reference Test field to the Debug Step View.
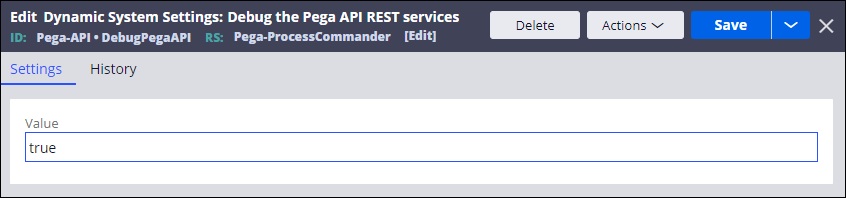
- Switch back to Dev Studio, search for the DebugPegaAPI Dynamic System setting and set it equal to true.
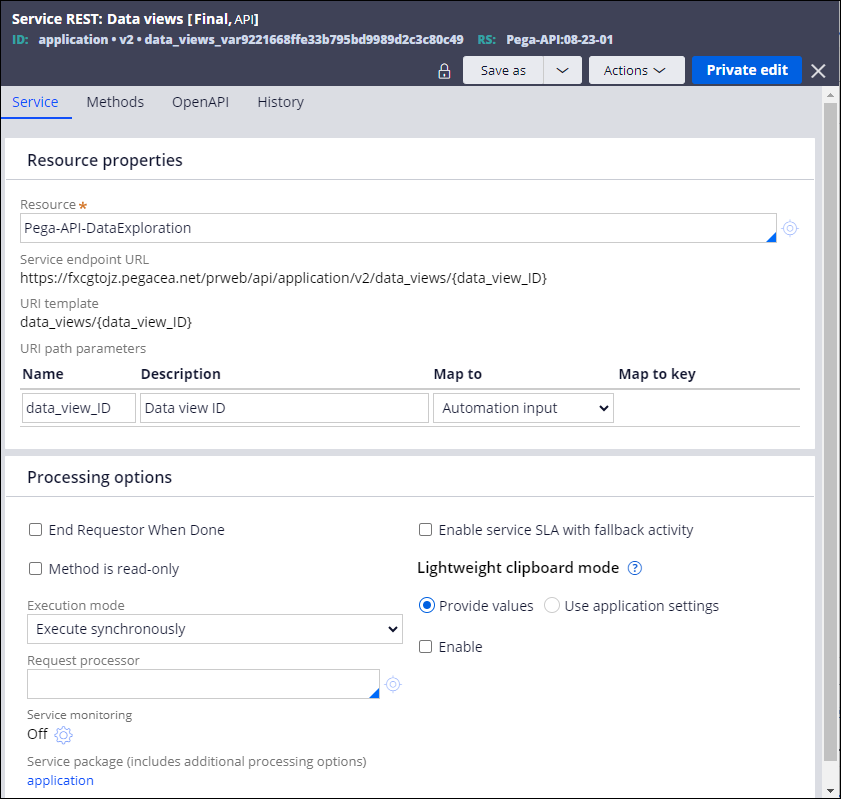
- In the navigation pane, click Records > Integration-Services > Service Rest to open the Service Rest that handles data Views (URL template: data_views/{data_view_ID}).
- Select Actions > Trace to start tracing the service.
- Launch the Customer Portal and create a new Research Case.
- Navigate to the Debug Assignment, and return to the Tracer.
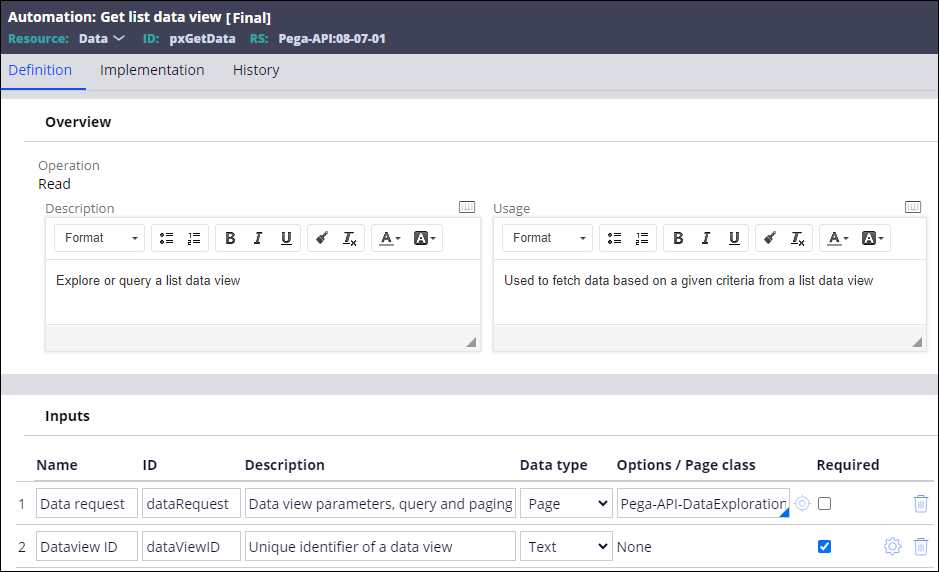
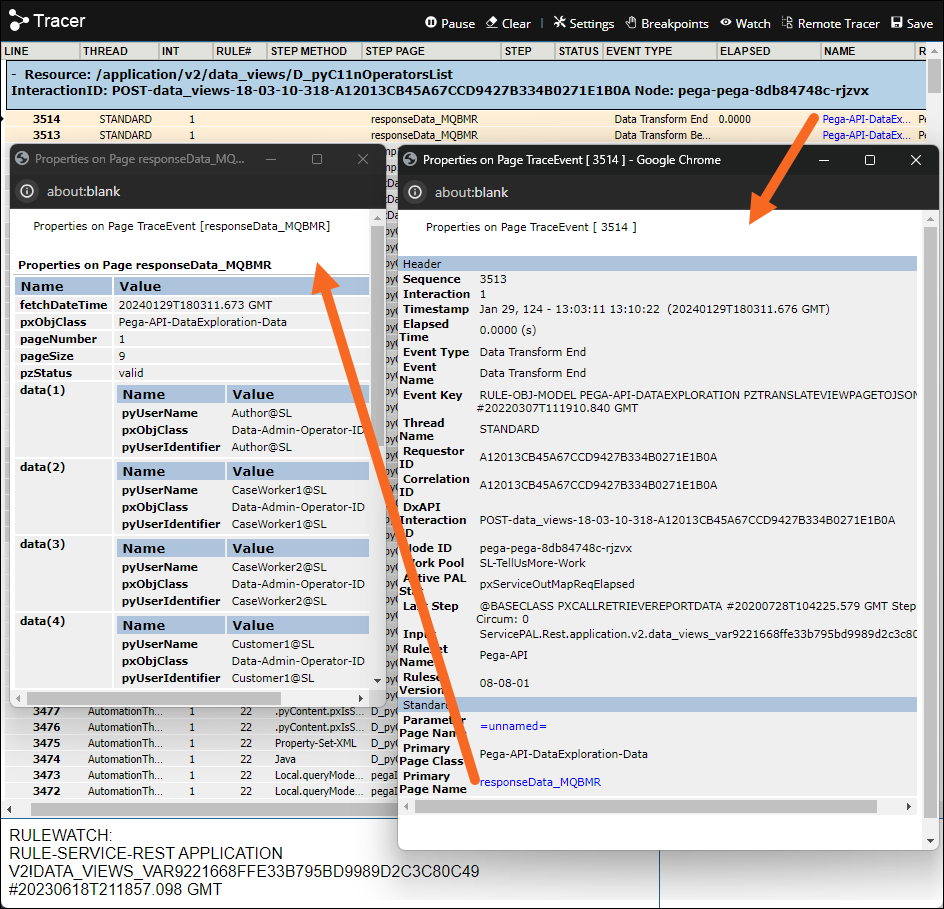
- Expand Resource: /application/v2/data_views/D_pyC11nOperatorsList and search for the Automation pxGetData.
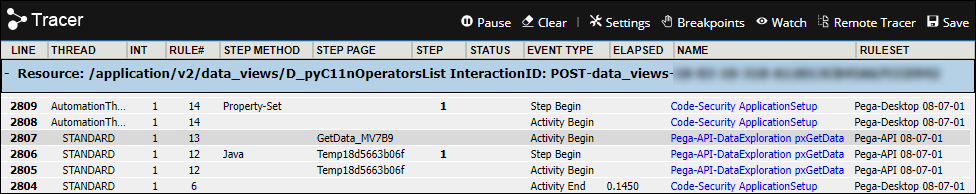
- Note that the pxGetData Automation returns data related to a list data View.
- Access the Tracer window and select the DataTransformEnd Event type and review the list returned as JSON.
- Close the Tracer windows related to the DataTransformEnd Event type.
7 Review the Data Page cache
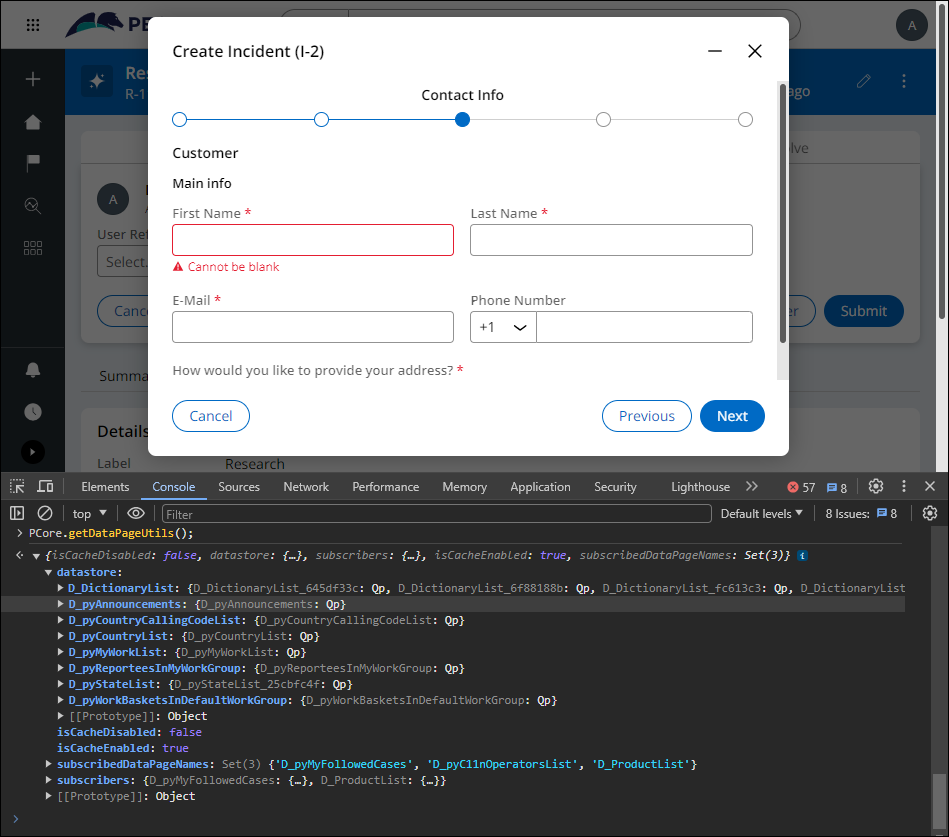
- Return to the Customer Portal and create a new Incident Case.
- Navigate to the Contact Info Step.
- Open the Developer Tools (F12), navigate to the Console tab, and enter: PCore.getDataPageUtils();
- Explore the Data Pages that are cached at the Contact Info Step.
- Close the Developer Tools window.
8 Examine React Changes with Redux Dev Tools
- Install the Redux-DevTools in your browser by searching for Redux DevTools, or:
- For Chrome, you can add the Redux DevTools from here: Google Chrome Store Redux DevTools
- For Firefox, you can add the Redux DevTools from here: Firefox Redux DevTools
- For Edge, you can add the Redux DevTools from here: Edge Redux DevTools
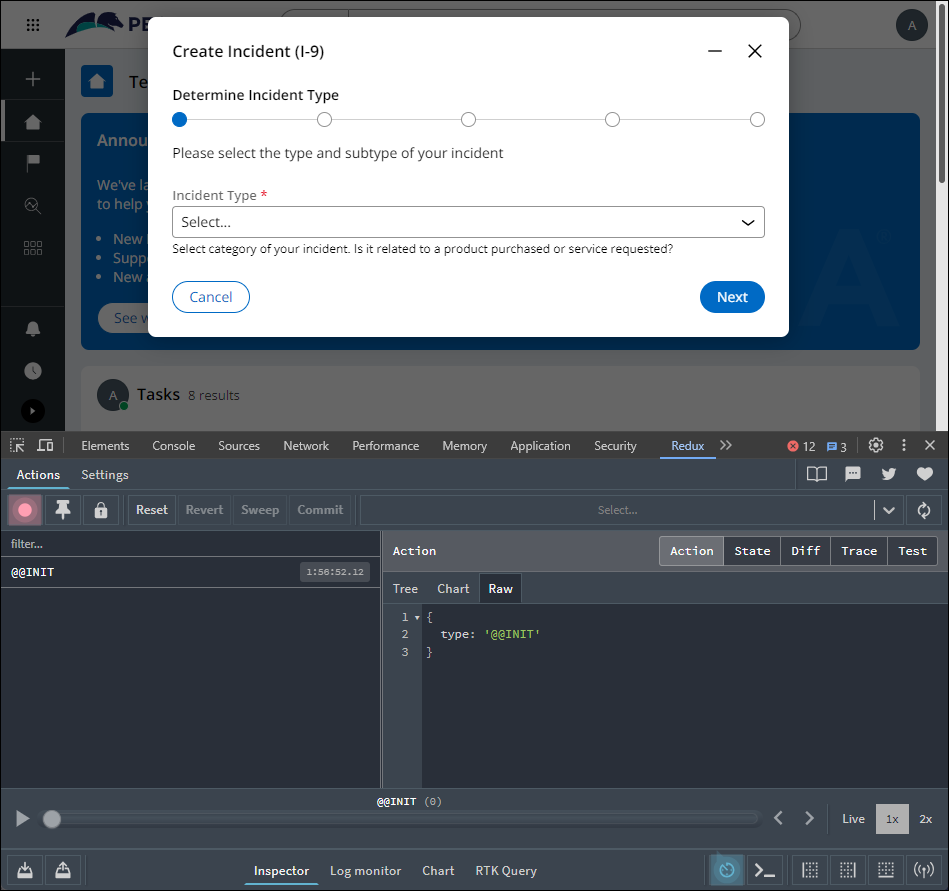
- Open the Dev Tools (F12) and navigate to the Redux Tab.
- Create a new Incident Case, and navigate to the Determine Incident Type Step.
- Note the changes to the Action information as you fill out the form.
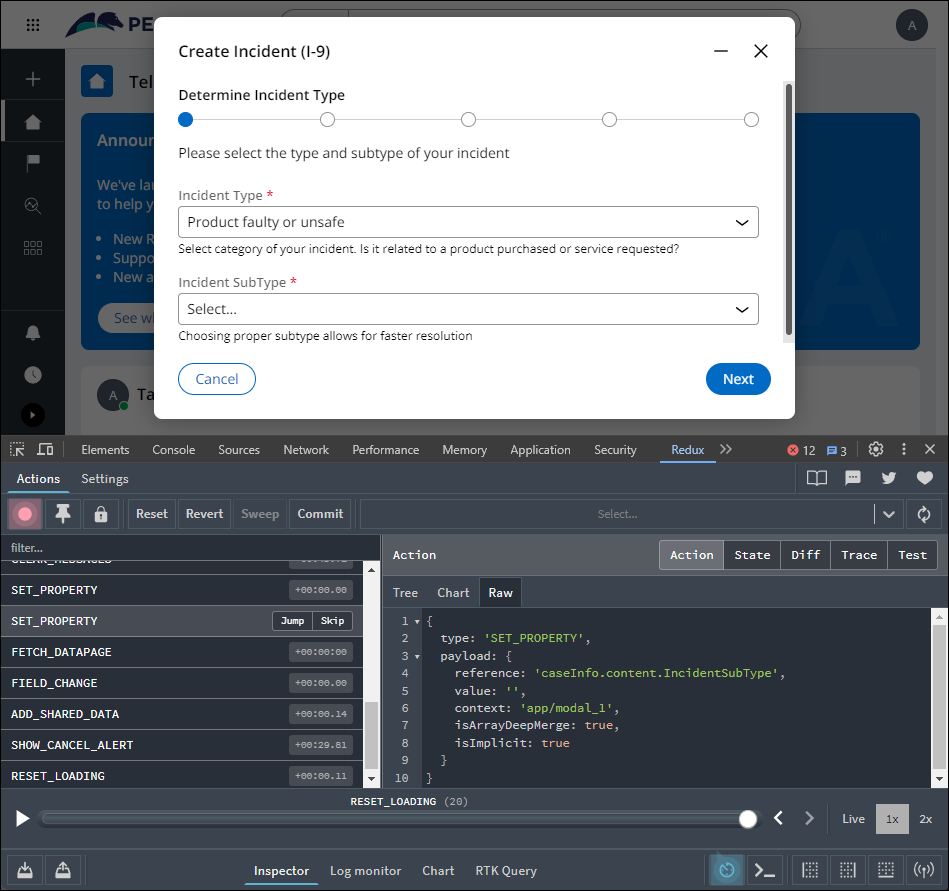
- Continue through the Incident Case and note how changes are recorded in the Redux Dev Tools.
This Challenge is to practice what you learned in the following Module:
Available in the following mission:
If you are having problems with your training, please review the Pega Academy Support FAQs.
Want to help us improve this content?