
The Tracer
The Tracer is a tool available in the Pega Platform™ that helps you with troubleshooting. When an error occurs in an application, it is important to identify the source. By examining the events that led to the error, you can find the root cause and fix the issue. The Tracer tool allows you to trace events that led to an error during application runtime.
For example, if a declare Expression sets a property value to an unexpected value, it might cause a workflow Stage to be skipped when it should not be. The user notices that the Case advances to an unexpected Stage and finds that the declare Expression property is not displayed in the UI. The Tracer tool documents the sequence of execution events to help troubleshoot the error.
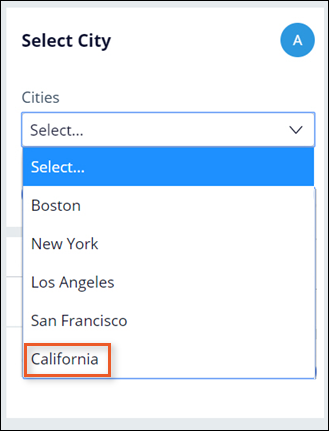
In another example, your application uses a Data Page to populate a drop-down list of cities. If the contents of the drop-down list are incorrect, you need to determine whether the control or the connection to the data source has an improper configuration.
In the following image, the drop-down list includes a state in a list of cities:
Access the Tracer
You access the Tracer by toggling the Runtime toolbar in App Studio. Hover your pointer over the lower-right corner of the screen to see the Toggle runtime toolbar option. Or, you can access the Tracer tool from the Developer toolbar in Dev Studio.
The following image shows the Tracer icon in App Studio and Dev Studio:

Tracer events
By configuring the Tracer to monitor application execution, you can investigate issues and events logged by the Tracer to identify their cause.
Tracer displays each event on a separate row. The records are displayed according to the following color code:
- Gray – Activity processing
- Orange – Events from flow, Decision, or declarative Rules
- Light blue – PegaRULES database and cache operations
The Tracer tool captures the different events that occur during Case processing. Each event is logged in order of occurrence and is identified by a thread, event type, and status.
In the following image, click the + icons to view details about some of the columns in the Tracer window:
Caution: Running the Tracer impacts application performance significantly due to the volume of data collected for Rule execution. As a best practice, do not use the Tracer as a performance analysis tool. To learn more about using the Tracer, see Tracer best practices.
Check your knowledge with the following interaction:
Identify errors in Case processing
As your application executes, the Pega Platform logs all the processing events that result from application execution, and it provides a detailed log of the events that occur during Case processing. This log helps you to identify the source of execution errors, such as Java exceptions or incorrect property values.
To help identify errors in Case processing, the Tracer identifies processing Steps in which an error has occurred. The Status column in the Tracer log helps you identify the processing Steps that lead to an error. In the Tracer log, most Steps return a status of Good, indicating that the Step was completed successfully. If a Step returns a status of Fail, an error occurred, and the Step is completed unsuccessfully.
The following image shows the Tracer tool displaying a failed Step:
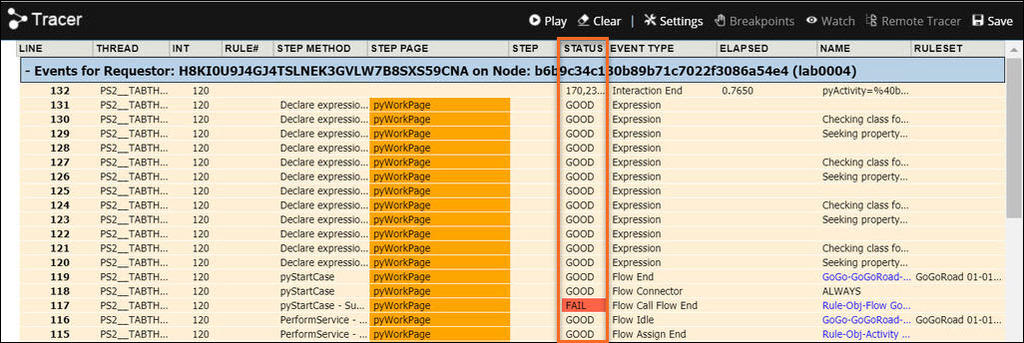
An error in an application may only indicate the last Step in a sequence of failed Steps but not the cause of the fail sequence. Reviewing the sequence of events in the Tracer helps identify the root cause that leads to the error seen by users.
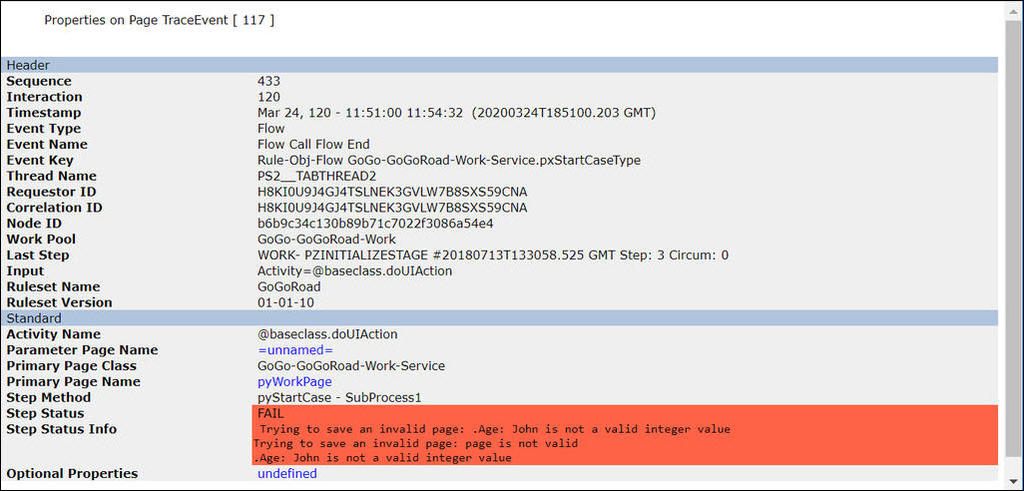
In the Tracer tool, when you click on the failed Step, the properties for that event are displayed. The following image shows the properties in a failed Step:
Note: To learn more about identifying the root cause of errors, see Tracing and capturing events.
Check your knowledge with the following interaction:
Tracer for Constellation applications
The Constellation applications are stateless and rely on DX APIs. The Tracer results window shows how your application interacts with a browser during a browser session. To provide clarity, the results window organizes events by request ID, as multiple requests can be active simultaneously.
For example, in the following image, you can see the multiple requests that occurred in the application:

This Topic is available in the following Modules:
If you are having problems with your training, please review the Pega Academy Support FAQs.
Want to help us improve this content?