Analyzing the impact of applying business levers
Archived
2 Tasks
20 mins
Beginner
English
Scenario
U+ Bank is cross-selling on the web by presenting various credit cards to its customers. Last year the business decided to boost the Credit Cards group by applying various business levers. The bank wants to analyze the impact of this change for the last year and current situation regarding the projected value of the Credit Cards so that the business can decide how to continue.
Use the following credentials to log in to the exercise system:
| Role | User name | Password |
|---|---|---|
| Decisioning Architect | DecisioningArchitect | rules |
Your assignment consists of the following tasks:
Task 1: Analyze the impact of applying business levers for the last year
Analyze the impact of applying business levers by exploring Impact Analyzer results and answer the following questions:
- What is the value lift and engagement lift that results from applying the business levers for the Credit Cards group in the last year?
- In which month was engagement lift the lowest?
- In which month was the value lift the highest?
Task 2: Analyze the potential impact of applying business levers
Create and run an audience simulation. Use the SampledCustomers_Inbound data set as the audience and engagement policy and arbitration as the simulation scope.
Then, use Scenario Planner to inspect the results and answer the following questions:
- What is the expected value that the business generates on the SampledCustomers_Inbound customer sample?
- Do you expect an opportunity gain or cost by applying the business levers? How much?
Challenge Walkthrough
Detailed Tasks
1 Analyze the impact of applying business levers for the last year
- On the exercise system landing page, click Pega Infinity™ to open Customer Decision Hub:
- Log in as a Decisioning Architect:
- In the User name field, enter DecisioningArchitect.
- In the Password field, enter rules.
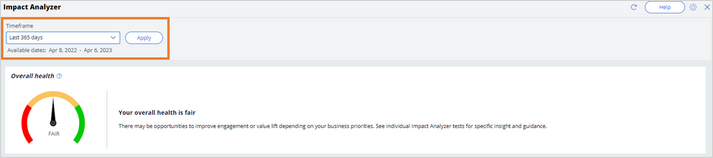
- In the navigation pane of Customer Decision Hub, click Discovery > Impact Analyzer to open Impact Analyzer.
- Question: What is the value lift and engagement lift generated by applying the business levers for Credit Cards group in the last year?
- In the Timeframe drop-down list, select Last 365 days and click Apply:
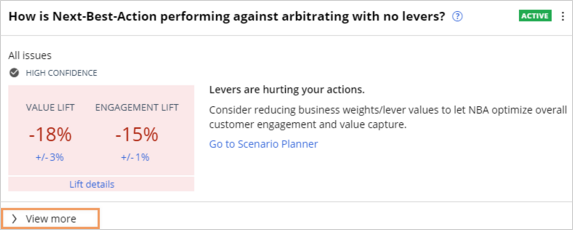
- In the How is Next-Best-Action performing against arbitrating with no business levers? experiment widget, click View more:
- In the All issues section, click Grow:
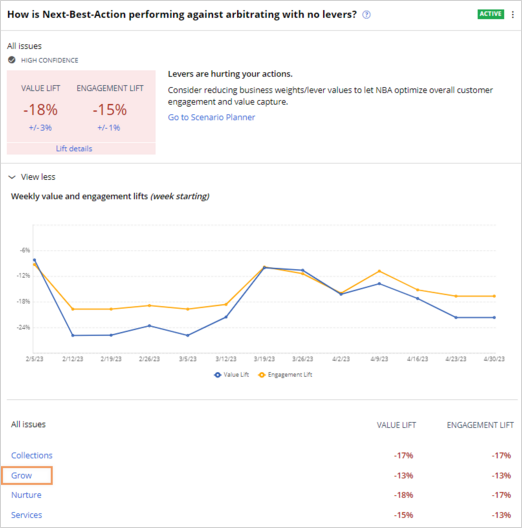
- In the All Issues/Grow section, click Credit cards:
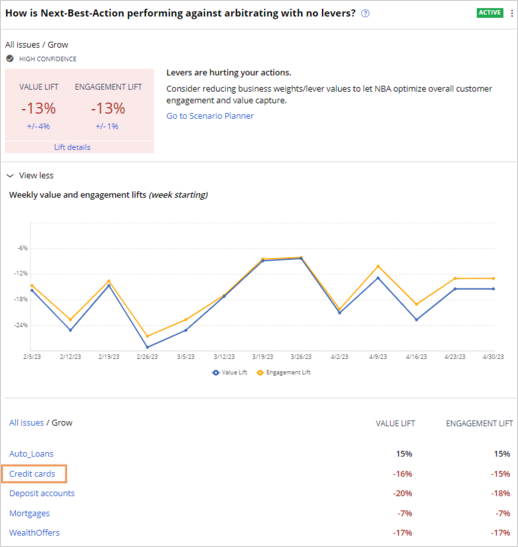
- Check the percentage values for the value lift and engagement lift.
As shown in the following figure, the expected percentages for this experiment are negative: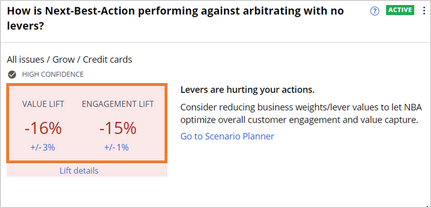 Note: The values of the value lift and engagement lift percentages might vary depending on the instance you are using.
- In the Timeframe drop-down list, select Last 365 days and click Apply:
- Question: In which month was engagement lift the lowest?
- Hover over the Monthly value and engagement lifts chart to see the exact values for each month:
Note: In this case, the lowest engagement lift was recorded in September 2022 and it equals -22.26%. However, the results may vary depending on the instance you are using.
- Hover over the Monthly value and engagement lifts chart to see the exact values for each month:
- Question: In which month was the value lift the highest?
- Hover over the Monthly value and engagement lifts chart to see the exact values for each month:
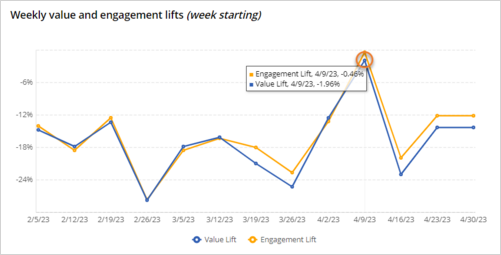 Note: In this case, the highest value lift was recorded in August 2022, at 12.20 percent. However, the results might vary depending on the instance that you are using.
- Hover over the Monthly value and engagement lifts chart to see the exact values for each month:
2 Analyze the potential impact of applying business levers
- Question: What is the expected value the business would generate on the SampledCustomers_Inbound customer sample?
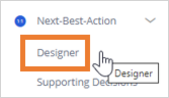
- In the navigation pane of Customer Decision Hub, click Next-Best-Action > Designer to open Next-Best-Action Designer:
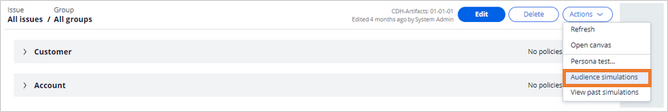
- In the Engagement Policy tab, click Actions > Audience simulation:
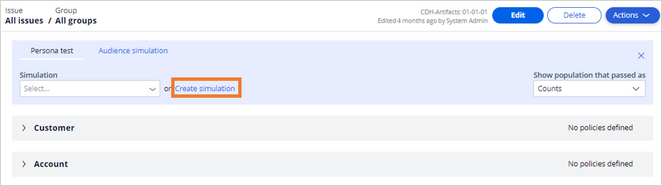
- In the Audience simulation tab, click Create simulation:
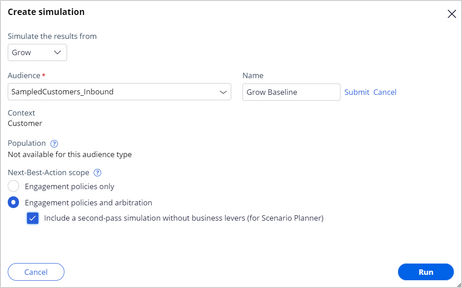
- In the Create simulation dialog box, configure the following information:
- In the Simulate the results from list, select Grow.
- In the Audience list, select SampledCustomers_Inbound.
- In the Name field, click the Edit icon, enter Grow Baseline, and then click Submit.
- In the Next-Best-Action scope section, select the following boxes:
- Select Engagement policies and arbitration.
- Select the Include a second-pass simulation without business levers (for Scenario Planner) checkbox.
- Click Run to run the simulation. The following figure shows the completed Create simulation dialog box:
 Note: The simulation run that you trigger initiates the next best action strategy on 1000 customers. In the current environment, this can take between 5 and 10 minutes. Wait until you see that the simulation status is complete.
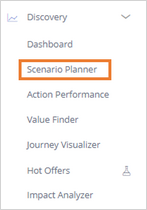
- In the navigation pane of Customer Decision Hub, click Discovery > Scenario Planner:
- In the Scope list, select Grow/All groups.
- In the Simulation list, select the Grow Baseline S-x simulation that you created.
- In the Comparison simulation list, select (S-x) with no levers, and then click Apply.
- Click Apply.
The following figure shows the completed Scenario Planner simulation dialogue box: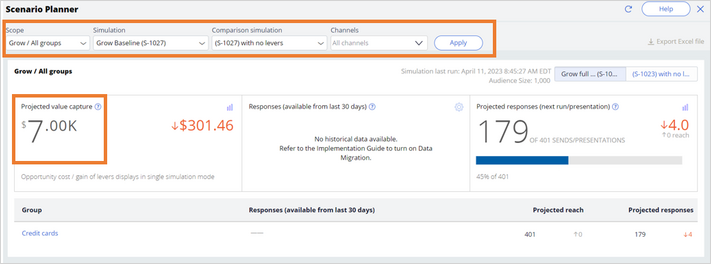 Note: The expected value the business wants to generate on the SampledCustomers_Inbound customer sample is $7.00k.
- In the navigation pane of Customer Decision Hub, click Next-Best-Action > Designer to open Next-Best-Action Designer:
- Question: Do you expect an opportunity gain or cost by applying the business levers? How much?
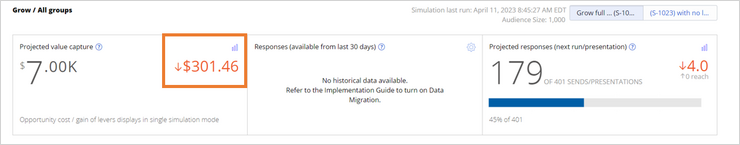 Note: In this case, the red delta value: $301.46 indicated the opportunity cost. The results may vary depending on the instance you are using.
- Click the chart icon to see the comparison between projected value capture:
 Note: In this case, the Projected value capture compared is lower for the actions arbitrated with business levers. As a result, the system records an opportunity cost.