
Assessing application performance
Archived
2 Tasks
10 mins
Intermediate
Performance
English
Scenario
The Human Resources (HR) department has noticed that the open positions screen of the candidate case type has been loading the list of positions slowly for some users. Investigate the performance characteristics of the screen and implement improvements that will reduce the loading time of the positions.
The following table provides the credentials you need to complete the challenge.
| Role | User name | Password |
|---|---|---|
| Senior System Architect | SSA@TGB | rules |
Note: Your practice environment may support the completion of multiple challenges. As a result, the configuration shown in the challenge walkthrough may not match your environment exactly.
Challenge Walkthrough
Detailed Tasks
1 Establish the initial baseline performance with PAL
- In Dev Studio, create a new Candidate case.
Note: Creating a new case prevents the first load from skewing performance results.
- In the footer of Dev Studio, on the Developer toolbar, click Performance to start the Performance Analyzer (PAL).
- Click the Reset to set the counts to zero.
- Click Add reading to add a row of summary performance data.

- In Dev Studio, create another new Candidate case.
- In the PAL window, click Add reading to add another row of summary performance data.
- Take a screen shot or make a note of the Server Elapsed and Total CPU numbers on the first Delta line, as shown in the following image.These values are the baseline performance of the Collect Personal Details screen.
Note: The Server Elapsed and Total CPU values may vary from the image below.

Tip: Take a screen capture of the PAL window as a way to document the performance values.
2 Enhance runtime performance
- In Dev Studio, click Data types > Position > List Position to open and edit the list position data page.
- In the Data page definition section, in the Scope list, select Requestor to prevent the data page from being created for every new Thread instance in the application, saving on memory space and processing time.

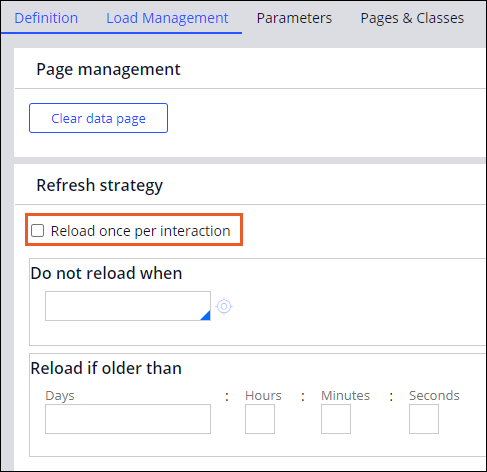
- On the Load Management tab, in the Refresh strategy section, verify that the Reload once per interaction check box is cleared to ensure the data page stays in memory and is only refreshed if the information is older than one hour, the default reload time.
- Save and close the data page rule.