Monitoring adaptive models
3 Tasks
10 mins
Beginner
English
Scenario
The U+Bank implementation for cross-sell on the web of their credit cards and the models have been learning for some time. Your task is to inspect the models and report on good and bad performing predictors.
Use the following credentials to log in to the exercise system:
| Role | User name | Password |
|---|---|---|
|
Data scientist |
DataScientist |
rules |
Caution: This challenge requires specific artifacts. Ensure that you click Initialize (Launch) Pega instance for this challenge to get the correct exercise system.
Your assignment consists of the following tasks:
Task 1: Inspect the adaptive models
Inspect the adaptive models by answering the following questions:
- Which model requires attention, and what is the performance of this model?
- What is performance of the two best performing models?
- What is the number of responses of the model which has the lowest number of responses?
- Which banner is the most successful?
Task 2: Inspect the predictors of the models
Inspect the predictors of the models by answering the following questions:
- Which three predictors have the highest performance across all models?
- Which predictors are not used in any of the models?
Task 3: Inspect a specific adaptive model
Identify the model with the highest number of responses, and inspect it by answering the following questions:
- What are the top three predictors used in the model with the highest number of responses?
- Which predictor, that is not currently relevant for the adaptive model, has the highest performance?
- Which age categories show the highest and lowest interest in this banner?
Challenge Walkthrough
Detailed Tasks
1 Inspect the adaptive models
- Log in as Data Scientist with user name DataScientist and password rules.
- In the navigation pane on the left, click Intelligence > Prediction Studio > Models.
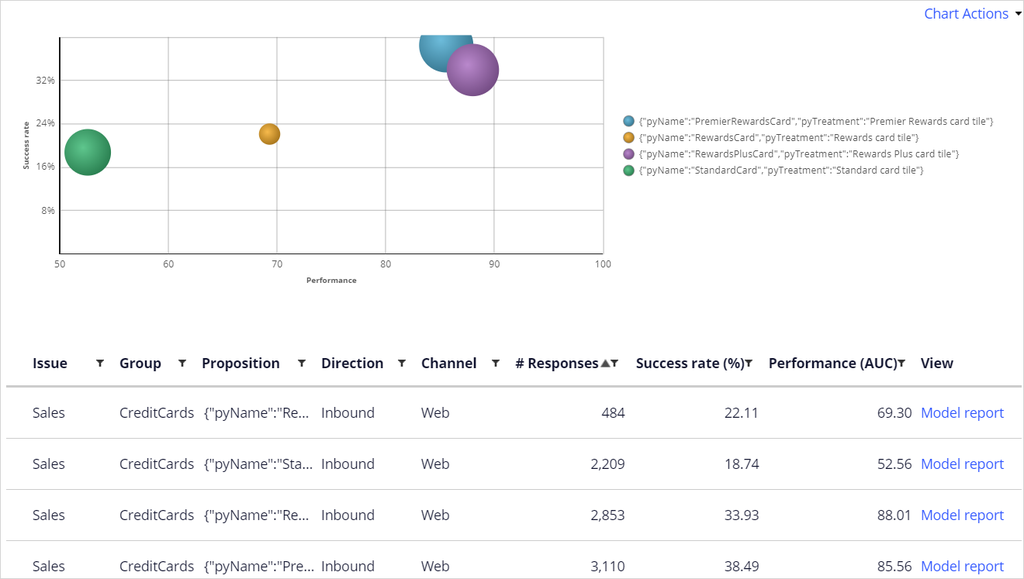
- Click the Web_Click_Through_Rate tile to open the model configuration.
- Click Refresh data.
| Question - Which model requires attention, and what is the performance of this model? |
- Hover over the model in the lower left corner of the chart.
Tip: Note the name of the model and its performance. The StandardCard model with a low performance of 52 requires immediate attention.
| Question - What is performance of the two best performing models? |
- Hover over the two bubbles in the top right corner of the chart.
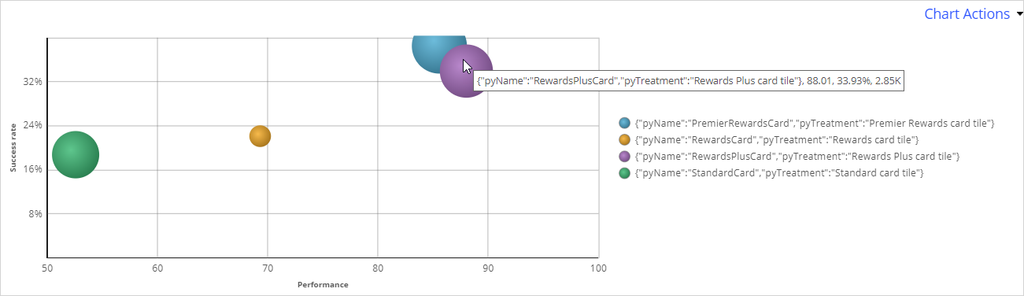
Tip: The two best performing models are RewardsPlusCard with a performance of 88 and PremierRewardsCard with a performance of 86.
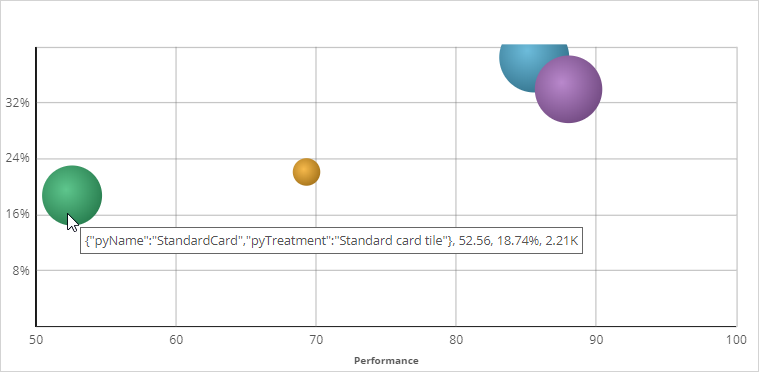
| Question - What is the number of responses of the model which has the lowest number of responses? |
- Hover over the smallest bubble in the chart.
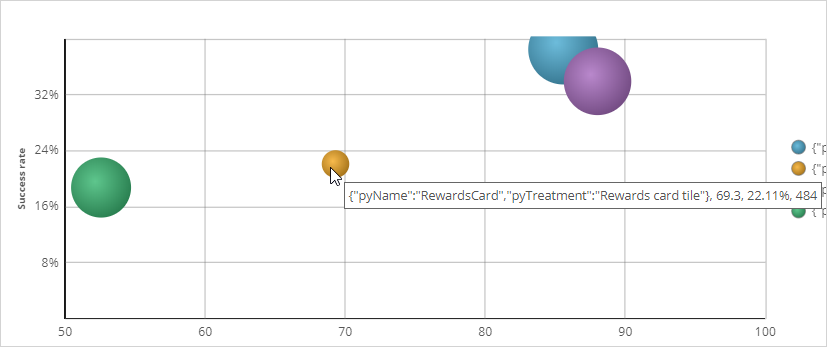
Tip: The RewardsCard model has the lowest number of responses of 484.
Note: In this web scenario, the success rate of the model is the click-through rate, the fraction of customers that clicks on the banner.
- Hover over the bubble with the highest success rate in the chart:
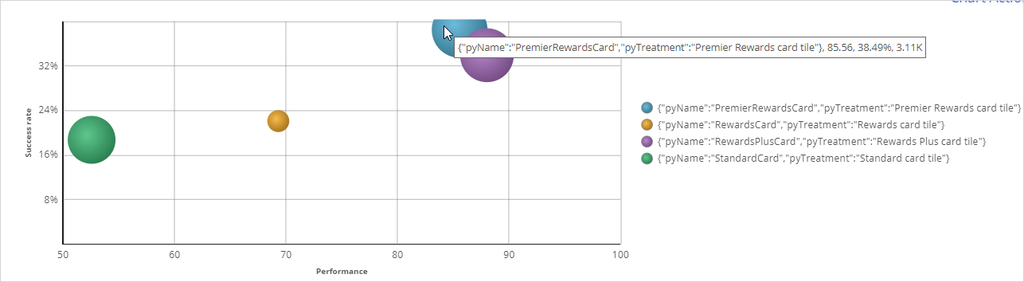
Tip: The PremierRewardsCard has the highest success rate of 38.49%.
2 Inspect the predictors of the models
| Question - Which three predictors have the highest performance across all models? |
- Click on the Predictors tab.

- Click on the Average performance column to sort on the average performance.
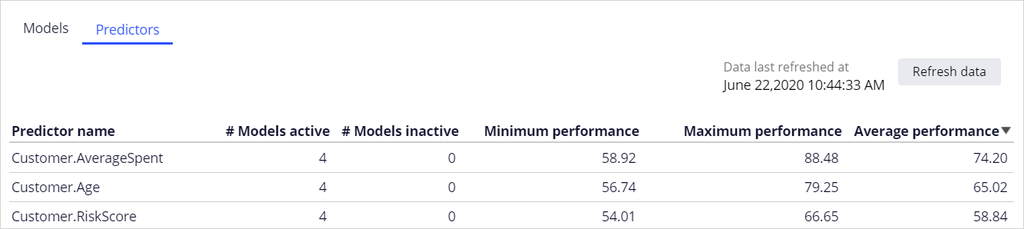
Tip: The three best performing predictors are: AverageSpent, Age, and RiskScore. All three predictors are used in all 4 models, as the # Models inactive value is 0.
| Question - Which predictors are not used in any of the models? |
- Click on # Models active to sort the models in an ascending order:
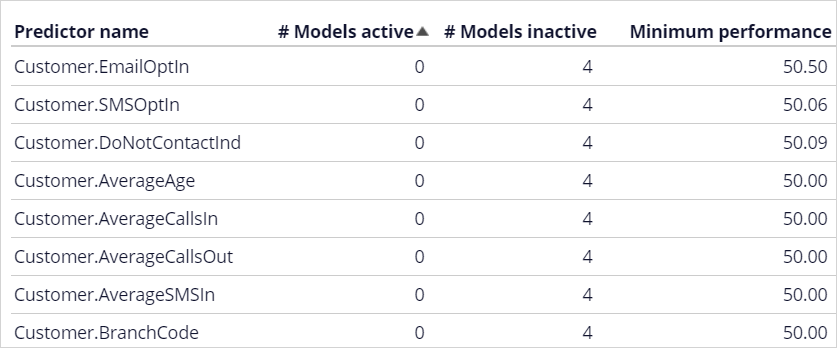
Tip: The predictors with a # Models active value of 0 are currently not used in any of the models.
3 Inspect a specific adaptive model
| Question - What are the top three predictors used in the model with the highest number of responses? |
- Click the Models tab.
- Click # Responses to sort the list of models in descending order.
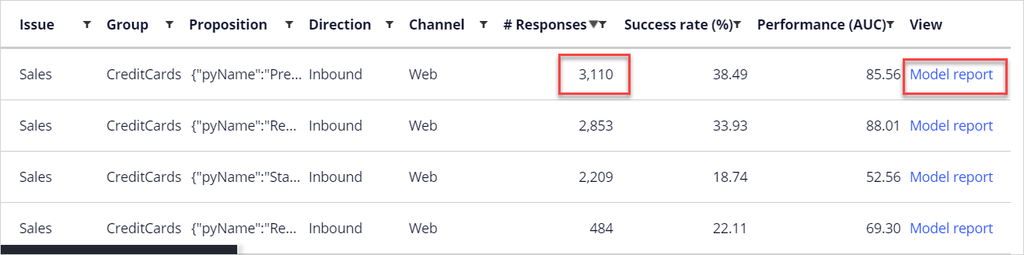
Tip: The first row identifies the model with the highest number of responses: 3110.
- Click on Model report in the first row.
- Click on the Performance (AUC) column to sort the predictors in descending order:
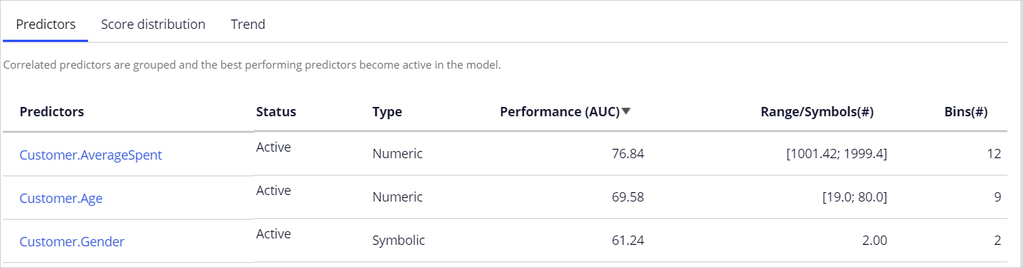
Tip: The top 3 best performing predictors for this model are AverageSpent, Age and Gender.
| Question - Which predictor that is not currently relevant for the adaptive model has the highest performance? |
- Scroll to the bottom of the list of fields and expand NetPromoterScore.
This is a list of corelated predictors, and the inactive predictors that are not used by this adaptive model. Examples include SMSOptIn, SubscriptionFlag, and MaritalStatus.
- Sort the list on Performance.
Tip: SMSOptIn is the inactive predictor with the highest performance of 51.71.
| Question - Which age categories show the highest and lowest interest in this banner? |
- Click on the Age predictor.
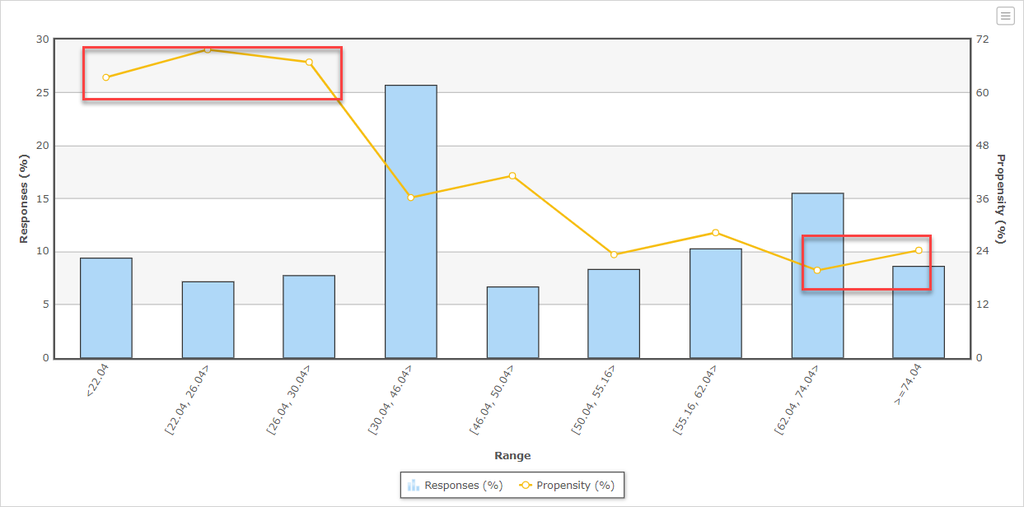
Tip: The highest interest for this banner is in the first 3 bins, with customers ranging in age from approximately 22 to 30. The lowest interest is shown by customers above 62 years old.
If you are having problems with your training, please review the Pega Academy Support FAQs.
Want to help us improve this content?