

Debugging Constellation applications
1 Task
35 mins
Intermediate
User Experience
Constellation
Low-Code App Development
English
Scenario
Due to the stateless nature of Constellation applications, the Pega Clipboard cannot be run from the user portal. Developers must use the Tracer tool, the UI Inspector, and browser DevTools to debug. The Tracer tracks execution flow and Rule performance; the UI Inspector examines View metadata, component properties, and UI element interactions.
Note: This challenge has been configured with Single sign-on (SSO) using your Pega Academy credentials. If you are not automatically signed-in to the challenge environment after initializing the instance, you may use the credentials provided.
The following table provides the credentials you need to complete the challenge:
| Role | User name | Password |
|---|---|---|
| Solution Builder | Author@SL | pega123! |
After completing this challenge, you should be able to:
- Access View JSON data.
- Use the Tracer to examine View Rules during Case execution.
- Use the UI Inspector to explore View metadata and component properties.
- Debug DX API calls using the
DebugPegaAPIDynamic System Setting. - Review the Data Page cache using browser DevTools.
- Examine React state changes using Redux DevTools.
Detailed Tasks
1 Debugging Constellation applications
Use the technical documentation linked in the Journey map above to complete the assigned tasks. The technical documentation might have more information than you need to complete the tasks.
Acceptance criteria
Task 1: Access View JSON data
- The pyConfirm View Rule for the
SL-TellUsMore-Work-Incidentclass is opened and access the View JSON information inside the rule XML. - In the JSON, the property displayed by
.pyWhatsNextis identified.
Task 2: Examine View Rules using the Tracer
- In the Research Case Type, an Address field of type Address is added to the Data Model.
- Address field is added in the Debug Step View under the Research Case Type.
- The Tracer is opened with View Rules enabled under Event Types to Trace.
- Research case is created and after submitting the Debug Assignment, the
Resource: /application/v2/assignmentsentry is expanded in the Tracer. - The
DATA-ADDRESS-POSTAL!PYADDRESSFORMlink is located by searching for View Start entries tied topyAddressForm, and the JSON metadata is reviewed.
Task 3: Explore View metadata with the UI Inspector
- In the Research Case Type, the Details Partial View is updated: the Primary fields View is removed and the Address field is added.
- Customer Portal is opened and The UI Inspector is launched using the following console command:
PCore.getDebugger().toggleInspector(); - The following components are examined in the UI Inspector:
Component Detail View pyHome Component AppAnnouncement (data source: D_pyAnnouncements) - The D_pyAnnouncements Data Page is opened and, The source,
pyInitAnnouncementsData Transform is updated with the following steps:Step Action Target Value Step 2 Append and Map .pxResultsNew page Step 2.1 Set .pyLabel"New authoring experience with Constellation" - After relaunching the Customer Portal, the new announcement bullet is visible.
Task 4: Debug DX API calls
- In the Research Case Type, User Reference Test field is added to the Debug Step View
- The
DebugPegaAPIDynamic System Setting is set to true. - Tracer is initiated from Service Rest: data_views/{data_view_ID}, Customer Portal is launched and new Research Case is created.
- In the Debug assignment, Author@SL is selected in the User Reference Test field.
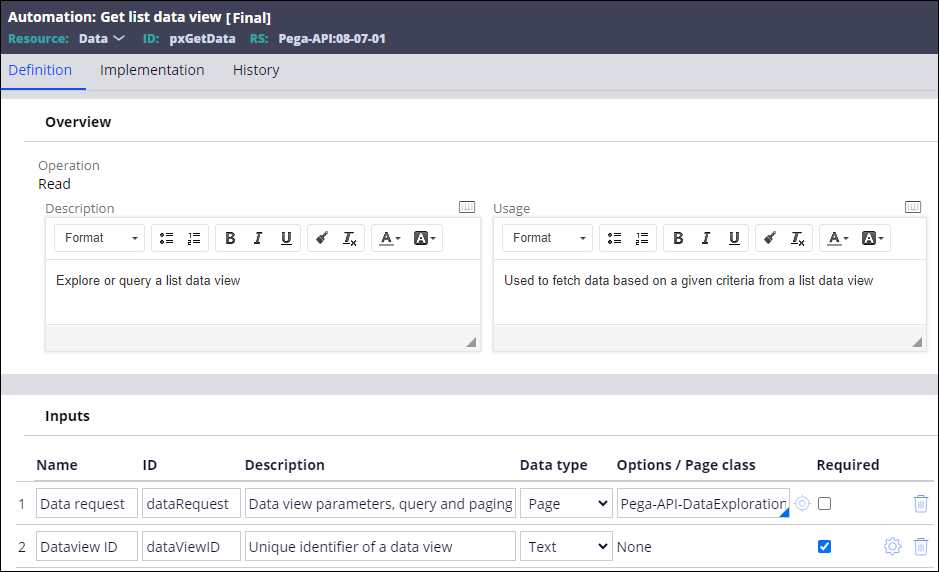
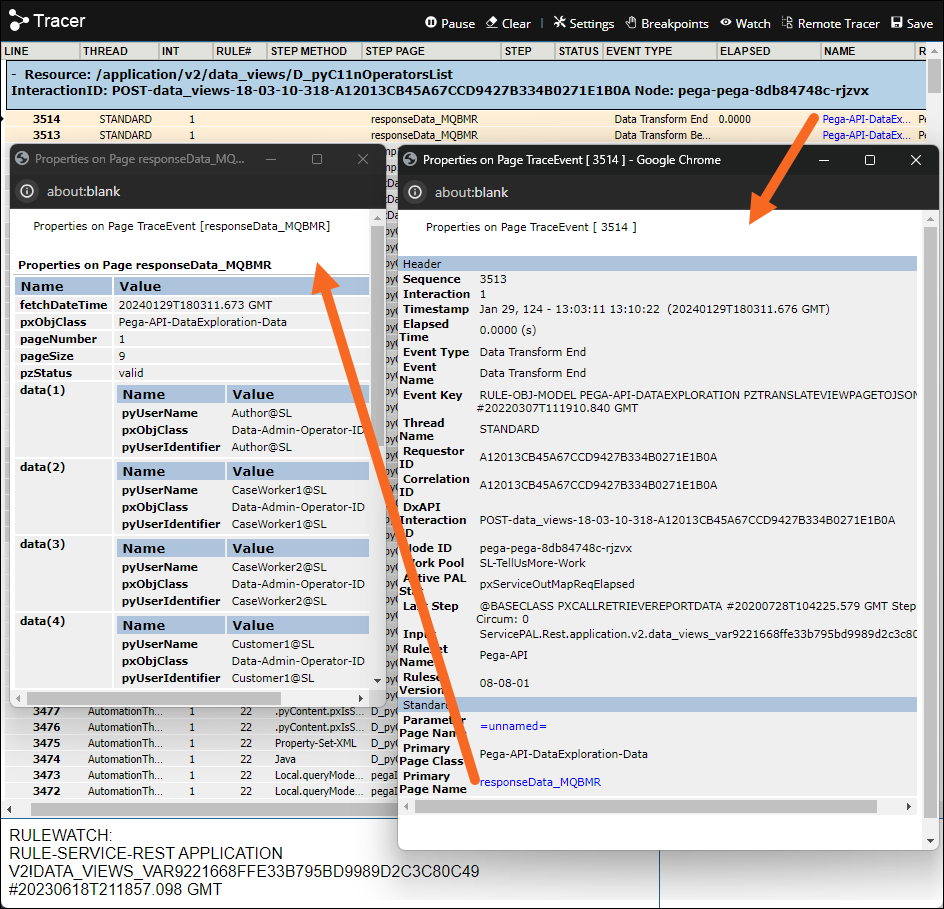
- In Tracer the Resource: /application/v2/data_views/D_pyC11nOperatorsList entry is expanded, and the pxGetData Automation is located.
- The Data Transform End event Pega-API-DataExploration pzTranslateViewPageToJSON is found and the JSON list is reviewed.
Task 5: Review the Data Page cache
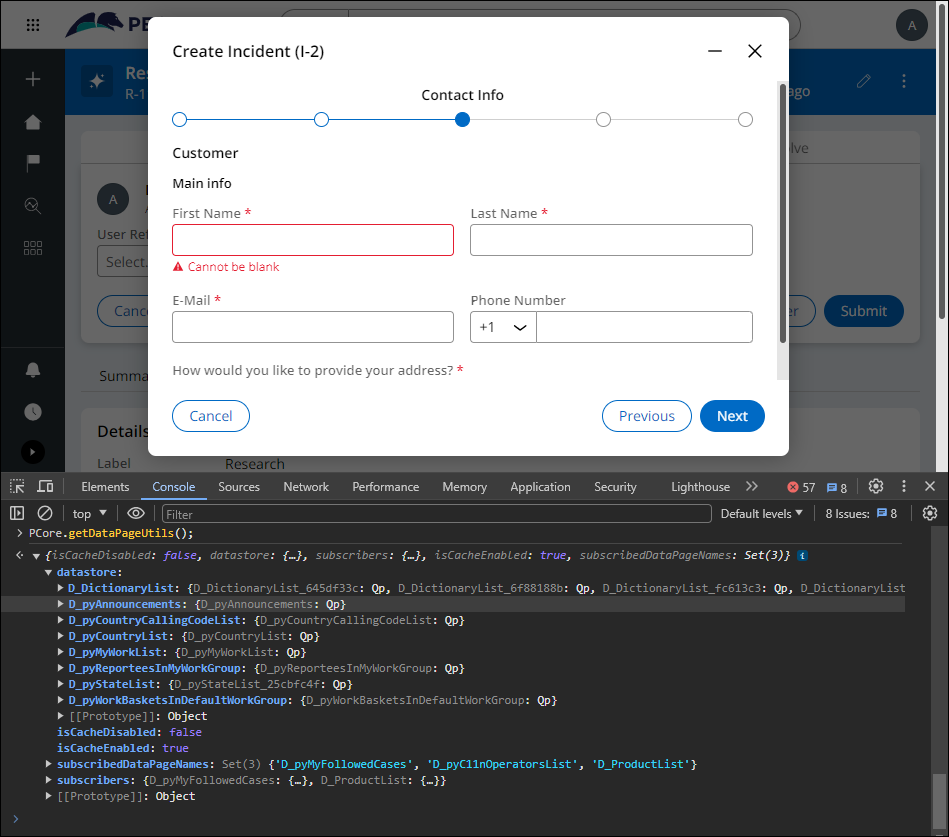
- In the Customer Portal, a new Incident Case is created and navigated to the Contact Info Step.
- Developer Tools is launched and the command
PCore.getDataPageUtils();is added under Console tab to explore cached Data Pages.
Task 6: Examine React changes with Redux DevTools
- The Redux DevTools browser extension is installed.
- For Chrome, you can add the Redux DevTools from here: Google Chrome Store Redux DevTools
- For Firefox, you can add the Redux DevTools from here: Firefox Redux DevTools
- For Edge, you can add the Redux DevTools from here: Edge Redux DevTools
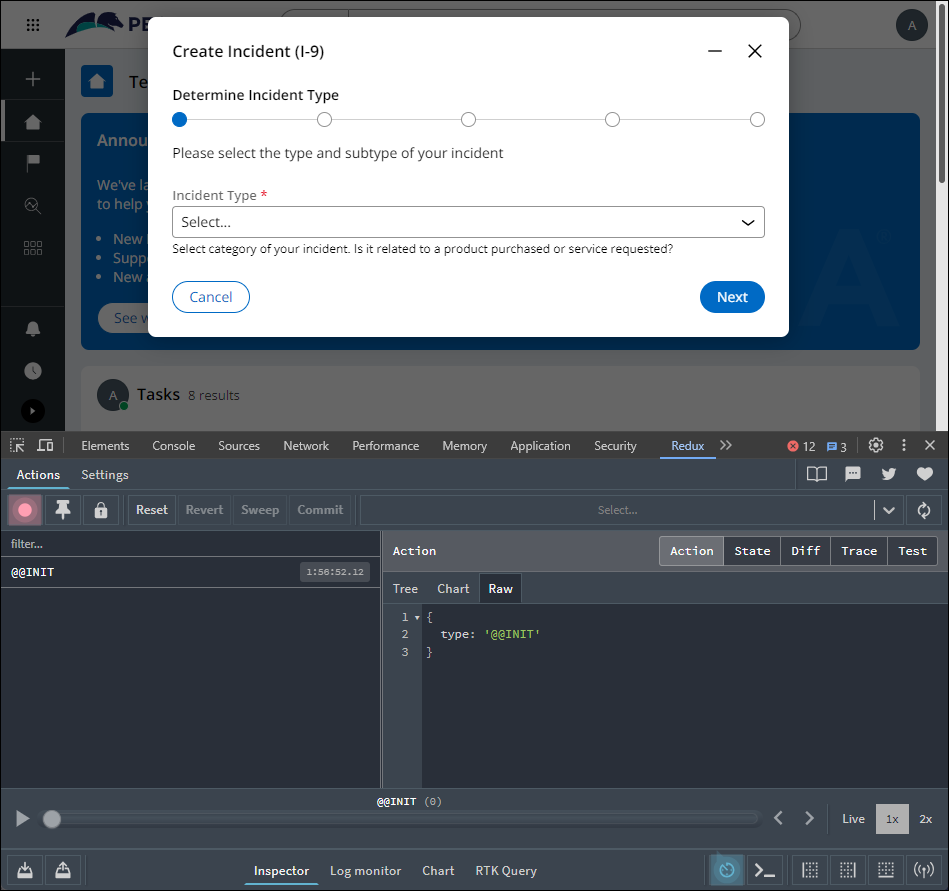
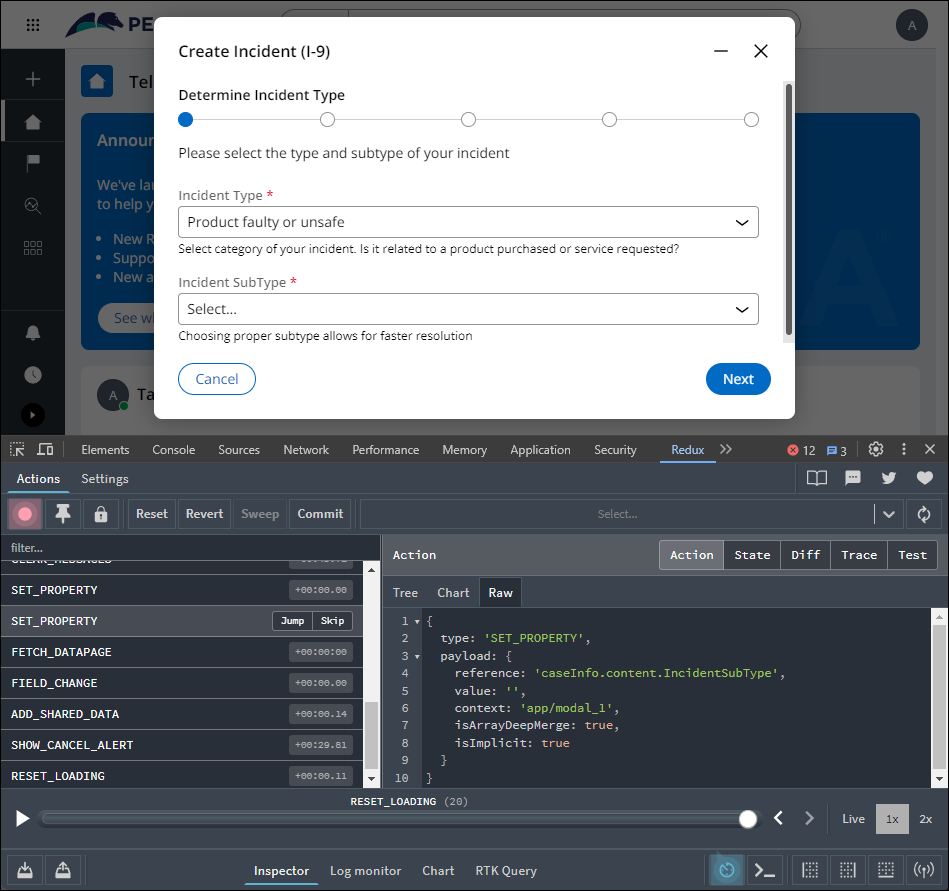
- Developer Tools is launched and Redux Tab is opened.
- A new Incident Case is created and navigated to the Determine Incident Type Step.
- Action information updates in Redux are observed as the form is filled out, and changes are noted as the Case progresses.
Directions
- Open the pyConfirm View Rule for the
SL-TellUsMore-Work-Incidentclass, and identify the.pyWhatsNextproperty in the JSON as detailed in the Acceptance criteria.
- Open the Research Case Type, add the Address field to the Data Model, open the Tracer with View Rules enabled, create a Research Case, submit the Debug Assignment, and locate the
DATA-ADDRESS-POSTAL!PYADDRESSFORMlink as detailed in the Acceptance criteria.
- Update the Details Partial View of the Research Case Type, use the UI Inspector to examine the pyHome View and AppAnnouncement component, update the
pyInitAnnouncementsData Transform as detailed in the Acceptance criteria, and verify the announcement appears in the Customer Portal.

- Enable the
DebugPegaAPIDynamic System Setting, trace the DX API call forD_pyC11nOperatorsList, and locate thepzTranslateViewPageToJSONData Transform End event as detailed in the Acceptance criteria.
- Create a new Incident Case in the Customer Portal, navigate to the Contact Info Step, and use the browser DevTools console command to review cached Data Pages as detailed in the Acceptance criteria.
- Install the Redux DevTools browser extension, create a new Incident Case, navigate to the Determine Incident Type Step, and observe how Action information and changes are recorded in Redux DevTools as detailed in the Acceptance criteria.
Available in the following mission:
If you are having problems with your training, please review the Pega Academy Support FAQs.
Want to help us improve this content?