
Admin Studio
is an authoring space for system administrators, database administrators, and security administrators that provides runtime information and configuration options for system resources.
In Admin Studio, you can observe system execution at runtime, such as monitoring job schedulers and queue processors, and managing system nodes. For example, as part of a software audit, a developer uses Admin Studio to identify active requestors, both human and system users, and monitor their usage.
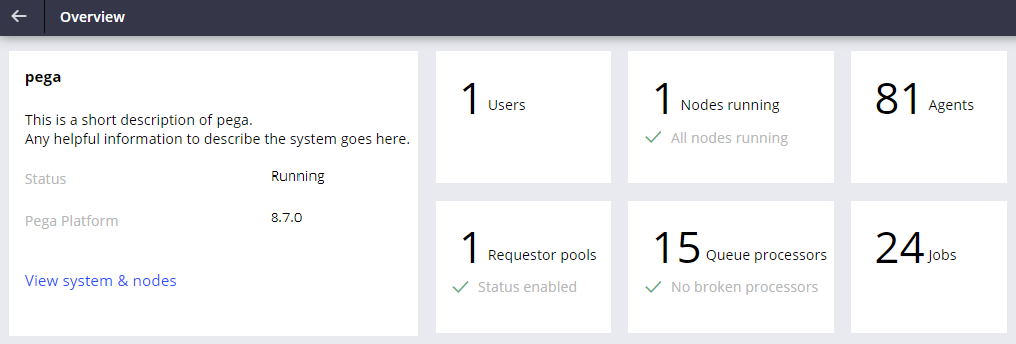
Overview landing page of Admin Studio
Each tile in the landing page lists the number of configured instances. For example, in the following image, the tile shows 15 queue processors, and all activities are running. There are no broken processors. Clicking each tile opens the corresponding landing page.
Queue processors and job schedulers must be enabled in the system before you can monitor the queue processor or job scheduler from Admin Studio.
Match the numbers to the following image to examine some of the options available for system management in Admin Studio:
1. Overview landing page of Admin Studio: The Overview landing page of Admin Studio contains information that you need to monitor queues. You can access system and node classification details, queue processors, and scheduled jobs.
2. Manage requestors: Monitor and debug requestor activity on the Requestors landing page in Admin Studio. The Requestors landing page displays summary information about Application, Browser, Batch, and Portal requestor types and lists all the active requestors in a specific cluster or node.
3. Jobs: View jobs and job success rate. Click a job to view details about the job in Infinity Studio.
4. Manage mobile settings: In Admin Studio, you can force a full synchronization and clear the cache for all users of the mobile channel when they next synchronize.
5. Manage listeners: In the Resources pane of Admin Studio, open the Listeners landing page to manage listeners. You can use the Listeners landing page to view lists of available listeners and associated nodes, debug and trace any problems with listener activity, and also start, stop, and restart listeners.
6. Manage log categories: On the Log categories landing page of Admin Studio, you can select which log messages to write to your log files by associating log levels with your categories. The log level of a category determines which messages are written to the log file.
7. Manage agents: For testing and debugging problems with agent activities, you can use the Agents landing page in Admin Studio to monitor, control, and manage agents. You can view a list of all the available agents across the whole cluster, on the current node, or on a remote node. You can check the status of an agent, see the number of running or stopped agents on a specific node, check the nodes on which the specific agent is running, or see the exception details for agents. You can also enable sending notifications on agent failure and specify the email address to which the notification is sent.
8. Manage requestor pools: Requestor pools are sets of requestors that are dedicated to processing incoming service requests from a specific service package. Use Admin Studio to manage requestor pools to tune the requestor pool configuration and efficiently manage the resources to improve the performance of services. In the Requestor pools landing page, you can view and group a list of all of the available requestor pools across the whole cluster, on the current node, or other nodes in the cluster (remote nodes). You can view basic requestor pool metrics, check the configured sizes of the pools, and clear a requestor pool for a specific service package.
9. Manage queue processors: Use the Queue processors landing page in Admin Studio to review information about queue processors in your system. You can trace queue processors and change the state of queue processors. When a queue processor rule causes issues, you can stop the queue processor rule temporarily from Admin Studio. You can also view information about queue processors, such as the node types on which the queue processors run or the number of broken items. You can also filter from the list of queue processors and then provide a name for this customized list as a saved view. Saved views allow your team to troubleshoot a list of queue processors and easily return to the view if you click away from it.
10. Manage job schedulers: Job schedulers are internal background processes on the server that run activities on a periodic basis. Create job schedulers in Infinity. Use the Jobs landing page in Admin Studio to trace and override Job Scheduler rules in your application. You can change the state of a job scheduler rule to disabled from the Jobs landing page in Admin Studio when the rule causes issues. For example, when the rule does not resolve an activity that is scheduled, disable the job scheduler until all issues are addressed.

Nota: For more information about filtering and saving a list of queue processors, see Saving queue processor views.
If you do not see a queue processor or job scheduler on the Overview landing page in Admin Studio, you may have to enable the system to find it. Set the system runtime context by configuring the application record and enabling the Include application in background processing option (located in the Advanced section of the Definition tab).
Check your knowledge with the following interaction:
Examine processors
Use the Queue processors landing page to trace, start, and stop queue processors. Tracing processes enables you to examine issues, such as failed activity steps, that may prevent the processor from committing an entry. You can trace processing throughout the system and analyze tracing results to identify and fix issues with queue processor Rules.
Data Flow
On the Queue processors landing page, you view advanced statistics on each queue processor by viewing the data flow.
The following image shows the data flow for the pyBatchIndexProcessor. Click the + icons to learn more about the components displayed in the data flow:
1. Data flow: In the data flow, you can view run warnings, duration, start time, number of processed records, and the average processing time.
2. Tabs: The basic information has three tabs: Component statistics, Distribution details, and Run details. These tabs provide more complex information to help you troubleshoot the processor.

Queue processor tracing
To ensure that the system processes your activities successfully, check the statuses of the activities that queue processors resolve. In Admin Studio, click Resources > Queue processors.
For example, you can identify and fix issues that affect indexing information about assignments to ensure that your data is available in the system.
Nota: You can trace only running queue processors. You must specify the activity to use when tracing the standard queue processor. Retrieval of the data about the queue processor takes up to one minute. To learn more about tracer, see Tracing a queue processor.
When a queue backlog grows, first verify that the queue processor is enabled, and then determine whether individual items are processing slowly or whether incoming volume exceeds the available processing capacity.
Job tracing
In Admin Studio, to trace whether your job runs when the activity it runs fails or does not work as expected, click Actions > Trace next to the job that you want to trace.
Two options are available:
- Click Trace any node to automatically choose the node (the node is randomly assigned).
- Click Trace specific node to select the node.
Check your knowledge with the following interaction:
This Topic is available in the following Modules:
If you are having problems with your training, please review the Pega Academy Support FAQs.
Quer nos ajudar a melhorar esse conteúdo?