Nota: This content describes procedures not covered in the module challenge. Your certification exam may include questions on these tasks.
Pega Predictive Diagnostic Cloud (PDC) is a Software as a Service (SaaS) tool that runs on Pega Cloud® Services. PDC actively gathers, monitors, and analyzes real-time performance and health indicators from all active Pega Platform™ applications.
Pega Platform sends known and safe content to PDC by using only the clipboard parameter data that is required for analysis. The data is sent asynchronously to minimize any performance impact on the monitored Pega Platform implementation. Data with identifying information (for example, case data) is not sent due to privacy concerns, and PDC does not request information from the monitored application.
Pega Platform gathers the following data for PDC:
Alerts: Identifies the type of alert and the metadata captured in an interaction.
Parameter page: Describes the parameters from the current parameter page, including important contextual information about the functions that run in the monitored application. All remaining parameters are filtered out and excluded.
Database alerts: Details the database query, excluding business data values.
Exceptions: Contains some contextual data that is a subset of the fields sent for alerts.
Performance statistics: Includes statistics for average response time and unique user count. PDC uses these statistics to identify overall performance and performance trends for monitored applications.
Database indexes: Includes database index information. PDC uses database index information to generate recommendations to improve query performance.
PDC dashboards
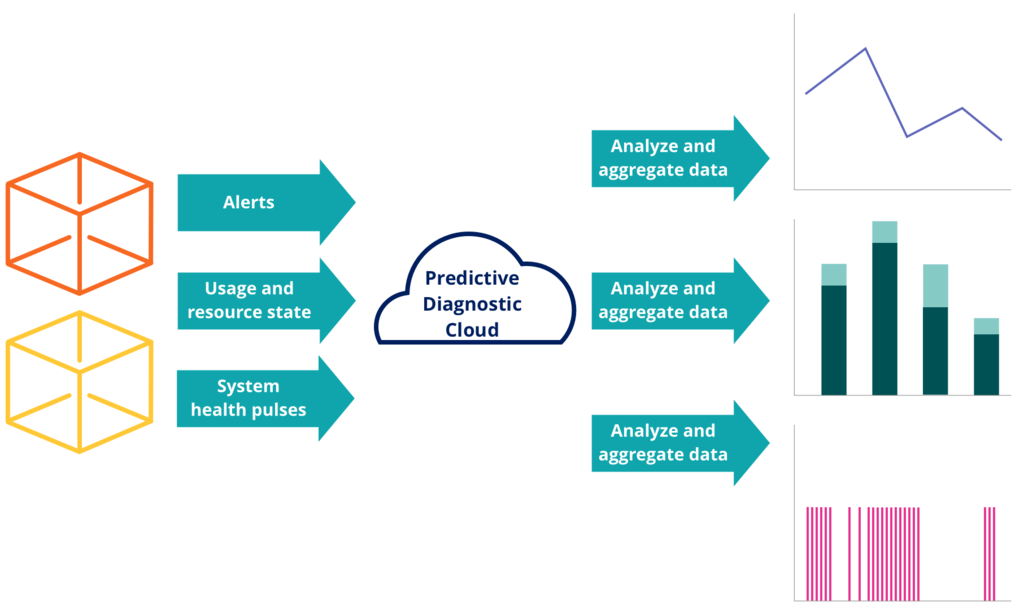
PDC analyzes and aggregates the data generated from Pega Platform applications to produce trending dashboards. The trending dashboards provide a graphical representation of daily average response usage, interaction volume, and user sessions counts. The presentation of data in trend graphs helps to monitor, isolate and identify and anticipate issues by presenting behavior over time. PDC empowers business stakeholders and IT administrators to take preventative action by predicting potential system performance and business logic issues and providing remediation suggestions.
PDC analyzes and aggregates data from alerts, usage and resource state, and system health pulses to generate trend graphs, as shown in the following image.
PDC allows you to monitor several on-premise and cloud-based Pega Platform applications. Systems that run on Pega Cloud already have PDC integration, and Pega Cloud provides a URL from which you access PDC.
Check your knowledge with the following interaction:
Issue Identification and research with Pega Predictive Diagnostic Cloud
Pega Predictive Diagnostic Cloud™ (PDC) helps you identify areas that you need to work
on to improve your system's performance. Use Improvement Plan to view a summary of issues
that affect the performance of your monitored system. Use Event Viewer to conduct an
in-depth investigation
Resolving issues in your system with Pega Predictive Diagnostic Cloud
Resolve common performance issues and find the root cause by using the Pega Predictive Diagnostic Cloud (PDC) problem-solving tools. With Event Viewer, you can access diagnostic data from all the nodes in your system.
To start resolving a performance or stability issue, consider the following actions:
In Improvement Plan, open a case, and then follow the recommended next steps.
In Event Viewer, view the log data from the past 14 days, and then analyze the issues that occurred during that time.
For example, if you know when your system failed, you can verify the alerts and exceptions that were generated at that time. By analyzing these events, you can determine the problem that caused the selected system to fail.
To quickly find the root cause of an issue, organize diagnostic data with customizable sets of filters.
For example, narrow the possible sources of diminished performance to a single user, node, or application.
Check your knowledge with the following interaction:
Notifications in Pega Predictive Diagnostic Cloud
Pega Predictive Diagnostic Cloud (PDC) provides
numerous measurements of your system that you can receive as messages to help you address
any issues that might occur. With these messages, called notifications, you can immediately
react to important issues in your system or counteract potential stability
problems.
To receive only the measurements that are relevant and useful for you, determine what
data you need to receive on a regular basis and what information is useful only when you
troubleshoot a specific issue. The type and frequency of notifications that can help you
the most depend on your user role.
Notifications are available only for events that are important and require immediate
attention or additional action.
PDC supports the following types of notifications:
Daily digest notifications
Periodic summaries of issues that PDC detects in your system. These
notifications focus on specific categories, for example, Improvement Plan
TOP 5 Web events or Improvement Plan TOP 5 Overall issues. You can configure
PDC to send daily digests in any range from daily to weekly notifications.
This type of notifications is most useful for manager roles for a general
overview of your system health.
Event-based notifications
Messages that PDC sends when a specific number of the same events occur
during a certain timespan. You can configure the event threshold and the
time interval for each notification. This type of notifications is most
useful for operations team members who can use them to swiftly react to
stability and performance issues.
You need to create separate notifications for each of your systems that PDC monitors.
Choosing daily digest notifications
As part of system governance, subscribers receive the following scheduled digests to
keep them up to date about the status of a monitored system:
Cases Summary
A summary of the active cases in PDC for the selected systems. Cases
require at least one alert in the last 7 days to be considered active.
The data is collected each day at 0:00 GMT. The report contains the
active cases for a 7-day period, the new cases that were created in the
last 24-hour period, and the number of unassigned cases.
To see the details of the new cases, see the New items daily
report.
CDH Usage Summary
A summary of Pega Customer Decision Hub™ usage metrics with information on
the month to date, the current day, the total usage, and the trend in
usage data.
Event Summary
A summary of events that occurred over a 24-hour period on the selected
systems.
Improvement Plan Top 5 Background
A report on up to the top five most urgent issues that affect background
processing for each of the categories on the selected systems (Database,
Connectors, General Performance, Stability, Runtime Guardrails, Custom
Cases, and Decisioning). The report displays the amount of time the
system spent processing background work and shows the percentage of time
spent last week compared to the time spent this week.
Improvement Plan Top 5 Overall
A complete Improvement Plan for the selected system with up to the top
five most urgent issues overall for each of the categories on the
selected systems. The report displays the amount of time that the system
spent processing web, service, and background work and shows the
percentage of time spent last week compared to the time spent this
week.
Improvement Plan Top 5 Service
A report on up to the top five most urgent issues that affect services
for each of the categories on the selected systems. The report displays
the amount of time that the system spent processing service requests and
shows the percentage of time spent last week compared to the time spent
this week.
Improvement Plan Top 5 Web
A report on up to the top five most urgent issues that affect the web
for each of the categories on the selected systems. The report displays
the amount of time the system spent processing web requests and shows
the percentage of time spent last week compared to the time spent this
week.
New items daily
A list of new issues that have been created in the last 24 hours.
Each notification informs you about an issue in your system, such as unresponsive
components, exceeded time thresholds, or low resources. PDC can detect hundreds of
thousands of events, and you cannot react to each event individually. Therefore,
subscribe only to notifications about the events that are most relevant to your
system. Because every application uses different components in different ways, you
choose notifications manually.
As a best practice, review the following notification types:
Focus on the events that can affect the stability of your system. These
events are marked as Recommended.
Check the list for events that require urgent attention and subscribe to the
events that apply to your system. These events are marked as
Urgent.
Check the list for infrastructure events that help you to manage resources
inside your system. These events are marked as Infrastructure
resources.
Look at other notifications and subscribe to the types that are most
relevant to your system.
After you use PDC for some time, you can revise the subscriptions to stay informed
about the events that are most relevant to your system and application.
During subscription, operators can add more than one account to each notification.
By default, PDC sends notifications by email. However you can configure PDC to send
individual notifications by SMS, notification API, or to ServiceNow.
You can further customize how you receive notifications using the notification API
feature in PDC. With the notification API, your system can receive notifications
directly from the API.
To connect your system to the notification API, the system must support the OAuth
protocol and be able to relay notifications to end users. During configuration, PDC
generates the following authentication data:
Pega Academy has detected you are using a browser which may prevent you from experiencing the site as intended. To improve your experience, please update your browser.