Analyzing customer distribution using Pega Value Finder
A Pega Value Finder simulation allows you to engage more empathetically with customers by identifying and profiling customers who receive irrelevant actions. A business can then analyze the Value Finder results to adjust engagement policies or create new actions and treatments.
Video
Transcript
This demo shows you how to analyze customer distribution by using a Pega Value Finder simulation.
U+ Bank, a retail bank, has recently implemented a project in which qualified customers see credit card offers when they log in to the self-service web portal. The bank wants to check if any restrictive engagement policies result in customers with irrelevant actions in the web channel and find ways to serve them better.
This is the Pega Customer Decision Hub™ portal.
In Discovery, you can create a new Value Finder simulation.
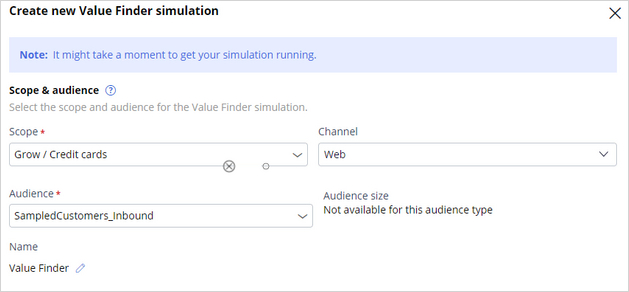
To create a Value Finder simulation run, select the issue and group and the channel in which you want to find opportunities. Then, select an audience on which to perform the simulation run. The audience is a list of potential target customers. You can easily modify the simulation name to identify the specific runs.
To see the simulation results, open the saved simulation. After the simulation run is complete, the Value Finder results display three areas: the scope, channels against which the simulation runs, and the number of customers in the simulation.
The right side of the screen shows the customer categories. Value Finder calculates these categories after each engagement policy stage. You can take a closer look at the categories of customers for whom engagement is low.
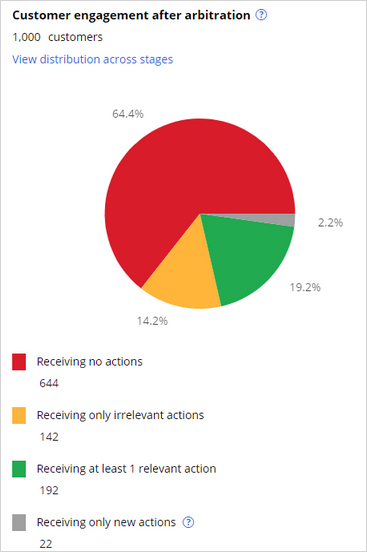
The pie chart on the left shows the results after Value Finder applies eligibility, applicability, suitability conditions, and arbitration.
In this example, 64.4 percent of customers are without actions. 14.2 percent of customers have only irrelevant actions. That means that the propensity to accept the action is low and is not good for customer engagement. Then, 19.2 percent of customers receive relevant actions and are more likely to accept the offers, which is good for engagement. Then, we have 2.2 percent of customers who receive only new actions. These are actions with an associated model that has not learned enough for you to rely on the propensity it produces.
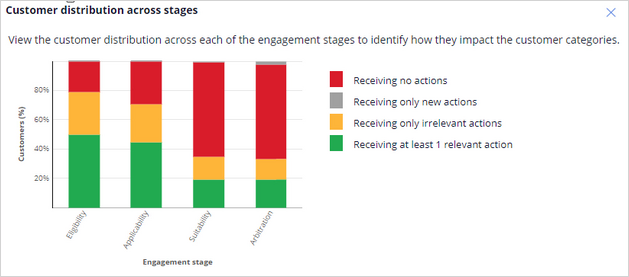
To understand the results better, you can view the distribution of customers in the four categories for each engagement stage: eligibility, applicability, suitability, and arbitration. The bar chart illustrates the impact that each stage has on customer engagement and allows you to compare engagement across the stages.
In this example, you can see that most customers get at least one relevant action after eligibility and applicability. But after you apply suitability, a portion of the green and orange bars moves to red. As a result, these customers receive no actions or only irrelevant actions that they are less likely to accept.
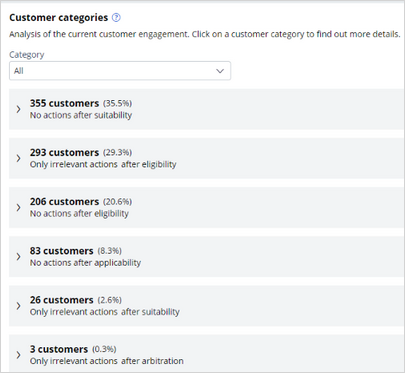
Value Finder identifies customer categories after applying eligibility, applicability, suitability, and arbitration rules. These categories represent value potential; you can improve engagement by addressing the issues that Value Finder identified. The system broadly classifies the categories into customers with no actions and customers with irrelevant actions.
In this case, you must look at the suitability stage to understand what is happening. Notice that 355 customers receive no actions, and 26 have irrelevant actions because the suitability condition might be too strict.
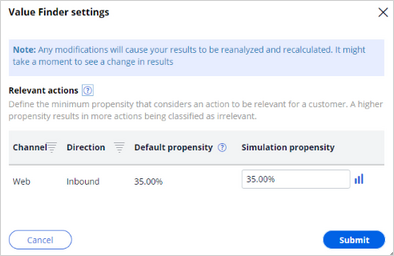
Value Finder precalculates the minimum propensities that determine whether actions in specific channels are relevant. The system calculates that the minimum propensities take half the average model success rate for a given channel and direction, regardless of the action. Actions with higher propensities are considered relevant. The precalculated propensities from the global default settings are available here.
This example shows only the web channel per the simulation scope. When no data-based suggestion is available for a channel direction, the minimum propensity value defaults to 5 percent. You can modify these default settings for a new simulation. These modifications do not impact the simulations that are already created.
Extension simulations
You can dive deeper into the insights of Value Finder by running extension simulations for each customer group identified.
For example, you can run an extension simulation for the Irrelevant actions after suitability customer group. After running the extension simulation, you receive two sets of insights that help you to:
- Analyze which suitability policies filter out relevant action for these customers across groups and actions.
- Review descriptions of similar customers, of which a large part is only receiving irrelevant actions.
Now, view the analysis and update the engagement policies to understand the number of relevant actions that are filtered out after group engagement policies are applied.
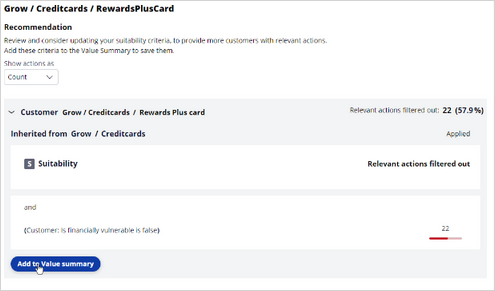
This extension simulation shows that only 26 customers have irrelevant actions after applying suitability conditions. However, there were 38 relevant actions available for the customers before the suitability conditions were applied. 26 customers had about 38 relevant actions, which Value Finder filtered after applying the suitability conditions.
In the table, you can view a breakdown of the policies that prevent customers from receiving relevant actions at the group policies level, the All issues level, and the All groups level. The breakdown shows that the 38 actions filtered out were Rewards Plus card actions and Premier Rewards card actions. You can further analyze and view the suggested recommendation to determine at which level the suitability condition prevents customers from receiving an action. Use this information to identify the suitability conditions that prevent these groups of customers from receiving actions, whether at the group or action levels. In this example, the Rewards Plus card action-level policy, Is financially vulnerable is false is where the system filtered out relevant actions.
To engage more customers, you can consider loosening a restrictive engagement policy by examining how many customers do not meet the policy conditions at the group or action level. You can add the findings to the value summary report to review them later. You can analyze the Premier Rewards card as well.
Customer groups
The Analysis of customer recommendation identifies customer groups that receive irrelevant actions. You can analyze these customer groups by using a distribution test to create new actions or treatments to serve these customers better. The system does not generate customer groups when there is insufficient evidence.
For example, if you create a new action or treatment for group A, there 75 customer engagements that you can improve address.
Details are provided for the Only irrelevant actions after suitability customer group to show how suitability conditions contribute to the issue.
Value Finder supplies insights about each group.
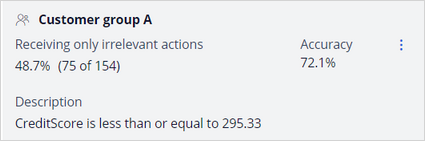
The Receiving only irrelevant actions line gives the number of customers with irrelevant actions in a group. The percentage is the number of customers in the group divided by the total number of customers identified as receiving irrelevant actions. In this case, the system identifies 75 customers out of 154 who receive irrelevant actions in Customer group A.
The Description line gives the group characteristics, such as CreditScore.
Accuracy is the number of customers with irrelevant actions in the group divided by the total number of customers in the group. If the accuracy is 72.1 percent, then 72.1 percent of customers in the group receive irrelevant actions. The remaining 100-72.1 = 27.9 percent have at least one action above the propensity threshold. If the accuracy, for example, is 100 percent, then all the customers in the group receive irrelevant actions.
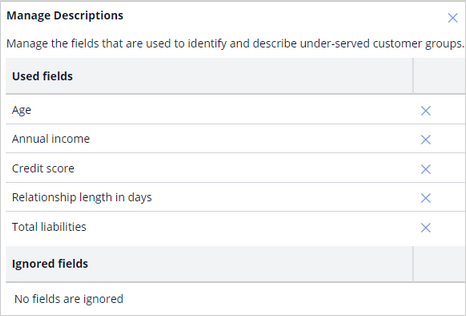
You can also manage the group by removing a field from the description. Typically, the system lists all potential fields that are available for the next-best-action strategy. You can remove a field from the list if it is not required. If you remove a field, Value Finder recalculates the values for Receiving only irrelevant actions and Accuracy.
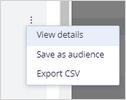
You can also save or export the customer groups with irrelevant actions as audiences.
You can then run distribution tests to get more insight into the current actions that these audiences receive. Use Value Finder recommendations and your distribution test results as feedback for business stakeholders. This information can inspire stakeholders to create new actions and treatments that are relevant to these customers.
This procedure applies to all Value Finder recommendations for customers with irrelevant actions and without actions, which you can view on the Value Finder landing page after you run a new simulation or display the results of a saved simulation.
Value summary
After you add the policies to the value summary, the value summary reflects the number of engagement policies in the summary.
Value summary shows the potential increase in customer engagement.
The value summary shows the insights you saved and the potential of addressing each issue. You can remove policies from the summary as needed.
You can download and share the value summary PDF with the Operations Manager team and then discuss whether to loosen this condition to let more irrelevant actions through. They can deploy this change and then monitor the effect.
This demo has concluded. What did it show you?
- How to configure and run a Value Finder simulation.
- What the top customer groups identified by Value Finder are.
- How to analyze the customer distribution across stages.
- How to run extension simulations.
- How to interpret the analysis of customers.
- How to interpret the customer groups identified to receive only irrelevant actions.
- How to drill down to identify conditions that prevent customers from receiving irrelevant actions and no actions.
- How to add policies to value summary to examine how many customers do not pass the policy conditions at the group or action level.
This Topic is available in the following Modules:
If you are having problems with your training, please review the Pega Academy Support FAQs.
Want to help us improve this content?