

Application performance issues
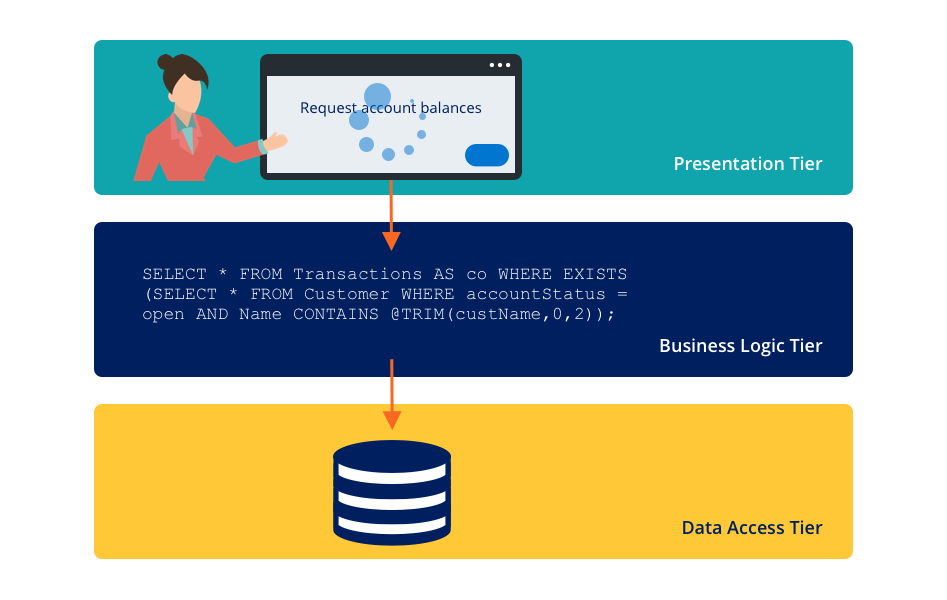
A system performance monitoring program includes monitoring environmental resources such as application JVM memory usage, application server CPU performance, database server performance, and application performance. An important first step to identify performance issues is understanding the multi-tier client-server architecture of Pega Platform™. The multiple handoffs among these application tiers can create difficulty in identifying the source of a performance issue.
Diagnosis of performance issues requires understanding the root cause of an issue. For example, users might report that an application takes a minute to render a form. A limited environmental resource, database interactions, or rules assembly might cause the issue. Pega Platform applications provide internal monitoring of performance and tools to identify common development and performance inefficiencies.
Design-time performance analysis
Poor application design can result in an application with performance bottlenecks that are difficult to diagnose and resolve.
Guardrails are application design best practices that help reduce the risk of introducing these types of issues. The best way to create a high-performance application is to follow guardrails and other design and implementation best practices throughout the development cycle.
Pega Platform monitors the rules that you create in your application for compliance with predefined guardrails. When you save a rule, Pega Platform performs a guardrail examination. If a rule violates a guardrail, Pega Platform applies a warning to the rule. This warning indicates the severity, the type of error that might result, a particular issue with the configuration of the rule, and often describes how to address the violation. Each rule can include multiple warnings.
For example, a property that is embedded in the case data BLOB and not optimized for reporting can result in poor performance when executing a report. The system displays a guardrail warning message to alert you to the potential performance impact when you save a report definition that violates this best practice, as displayed in the following image:
Pega Platform provides a compliance score that enables you to assess the overall quality of an application quickly. The compliance score is displayed on the Application Guardrail landing page.
Use the Compliance score to monitor the overall quality and maintainability of your application and identify areas that require attention. The compliance score is a weighted measure that compares the number of rules with severe or moderate guardrail warnings to the number of rules without warnings or with caution level warnings. Pega Platform core rules are not included in this assessment. To promote application quality, aim to maintain a compliance score of 90 or higher, and take immediate action if the score falls below 80. On the Application Guardrail landing page, the Compliance score section displays the percentage of compliant rules, the total number of rules, the number of rules with warnings, and the number of rules with unjustified warnings.The following image shows an example compliance score:

Check the application compliance score and resolve guardrail warnings as you progress in development before moving to run-time performance analysis. The Compliance Details tab on the Application Guardrail landing page displays the specific performance risks, including the number of severe warnings to address immediately and the moderate warnings to resolve before production.
Tip: On the Application Guardrails landing page, use the Schedule report option to regularly send stakeholders the compliance score to help ensure the score remains above a certain threshold.
Because new releases of Pega Platform add new guardrail validations and warnings, reassess guardrails or revalidate rules following an application update. When a client application updates to a newer release, any new guardrail best practices do not automatically apply to rules that already exist in the application. Pega Platform provides a feature to revalidate rules by ruleset, so the new warning is applied to old rules.
Note: To learn more about executing the revalidation process, see About the bulk Revalidate and Save tool.
Run-time performance analysis
System performance has many dimensions, so it is important to determine goals and measures of success as the first step in performance testing analysis. For example, an end user might believe that system performance is determined by the response time, while a business might believe system performance is determined by throughput.
Pega Platform generates system alerts at run time based upon various performance thresholds you set in the prconfig.xml file or Dynamic System Settings. The alert is a text entry or message indicating that a specific interaction or rule execution has exceeded a performance threshold. The message also identifies the type of requestor (for example, browser or batch requestor) and the activity or stream that triggered the alert.
Caution: Cloud customers do not have access to modify the prconfig.xml file. Instead, Cloud customers use the Dynamic System Setting option to implement performance alert thresholds.
The following example of message text illustrates a threshold violation alert:

Pega Platform writes the alerts to the performance alert log during application processing. You can view the Logs landing page in Infinity Studio, or Pega Platform offers the Pega Diagnostic Center (PDC) monitoring application to capture, analyze, and manage alerts. This application greatly enhances monitoring features by providing a health-check dashboard, enhanced analytics, and database table index recommendations.
Note: Performance data can be viewed through multiple monitoring tools. Alert management and root-cause analysis tools help identify performance issues, while dashboarding and visualization tools help identify long-term trends and capacity concerns. These tools work together to provide a comprehensive view of application health.
Monitoring AI-assisted feature performance
Performance monitoring includes metrics and alerts for AI-assisted features. Monitoring tools automatically collect run statistics and generate alerts when configurable thresholds are exceeded.
Examples of monitored conditions include:
- Run time that exceeds a defined threshold
- Language model processing time that exceeds a defined threshold
- Excessive token usage or rate limiting events
Performance statistics for AI-assisted processing are available alongside other application performance data, helping identify slow or resource-intensive interactions. Thresholds can be adjusted through Dynamic System Settings.
Identification of performance issues by using alerts
Identifying the cause of performance issues in an application can be challenging. An application can present various performance issues such as excessive response times, lengthy request result sets, invalid data returns, database deadlocks, and too many open connections. For example, performance issues such as excessive response times may be caused by a poorly written SQL query in the application, network latency, or performance issues with the database server.
Performance alerts can also help you to identify the root cause of a performance issue. You can use a combination of alerts to identify the pattern or cause for a specific alert to appear frequently. For example, the alerts in the following table can help you identify the cause to troubleshoot an excessive response time issue.
Common alerts include:
| Error number | Error name | Reasoning |
|---|---|---|
| PEGA0001 | HTTP interaction time exceeds limit | Exceeding a time threshold for long-running calculations, waiting for database connections or responses, or waiting for information from an external service |
| PEGA0002 | Commit operation time exceeds limit | Exceeding a time threshold for a database commit operation |
| PEGA0004 | Quantity of data received by database query exceeds limit | Exceeding a byte threshold when a query loads an excessive quantity of data |
| PEGA0005 | Query time exceeds limit | Exceeding a time threshold for a query to run |
| PEGA0026 | Time to connect to database exceeds limit | Exceeding a time threshold to connect to a database |
| PEGA0030 | The number of requestors for the system exceeds limit | Exceeding a numerical threshold for the number of requestors |
Note: To view a complete list of alerts and more details about each, see Performance alerts and Security alerts.
Correlate related alerts before determining root cause
A single alert rarely provides enough information to identify the source of a performance issue. Review related alerts from the same interaction, requestor, node, or time window to understand how multiple events contribute to the overall performance problem.
Managing performance alerts
Performance alerts help identify application activities that exceed expected operating limits. Some alerts use fixed thresholds, while others compare current behavior against historical performance patterns. Understanding both approaches helps determine when performance issues require investigation.
| Monitoring approach | When to use it | Example |
|---|---|---|
| Threshold-based alerting | When a clear limit defines acceptable performance. Generates an alert when a configured value is exceeded. | A database query generates an alert when run time, returned data volume, or response time exceeds a configured threshold. |
| Baseline-driven alerting | When normal performance varies over time and unusual deviations are more meaningful than a fixed limit. Generates an alert when performance differs significantly from established operating patterns. | Background processing duration or queue wait times increase significantly compared to their historical baseline. |
Performance thresholds often have default values that can be adjusted to align with organizational performance goals. Dynamic System Settings (DSS) are the preferred method for maintaining performance-related settings. Some deployment models also support configuration through system configuration files.
Before adjusting thresholds or investigating alerts, establish performance goals and success measures. Load testing helps identify potential issues before production deployment. When evaluating optimization opportunities, focus on overall business impact. A small improvement to a frequently used process often delivers more value than a significant improvement to a rarely used task.
For example, threshold-based monitoring can identify database queries that return excessive amounts of data. An organization might configure a warning threshold for large query results and a higher threshold that generates an error when exceeded. This approach helps identify inefficient database operations before they affect application performance.
Check your knowledge with the following interaction:
This Topic is available in the following Module:
If you are having problems with your training, please review the Pega Academy Support FAQs.
Want to help us improve this content?