Measuring lift using a control group
Introduction
The boost in success rate achieved with adaptive models can be measured using a control group in Predictions. Predictions are strategies that add best practices to predictive models. Customers in the control group will receive a random offer instead of the one recommended by the AI. This allows a comparison between the control group and the rest of the audience. It also enables the models to explore alternative outcomes.
Video
Transcript
This demo shows you how to use a control group to measure the boost in success rate the adaptive models achieve.
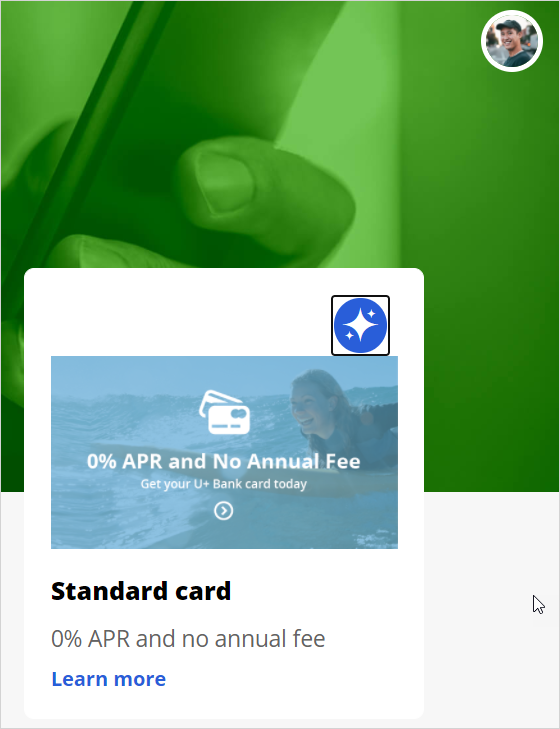
U+ Bank is a small retail bank. When customers log in to the U+ Bank website, they see the credit card offers for which they qualify based on the engagement policy defined by the business.
When customers qualify for multiple credit card offers, adaptive models decide which is the best offer to show.
Adaptive models are self-learning and will automatically learn from customer interactions.
The models interpret a click on the offer banner as positive behavior. When a customer ignores the banner, this is interpreted as negative behavior. Models are updated frequently.
An important business metric is the lift in success rate that the models generate.
To measure and report on this metric, a data scientist can use Predictions. Predictions add best data science practices to predictive models.
One of these is to use a control group as a benchmark for measuring the lift that the models achieve.
All out-of-the-box predictions available are listed on the Predictions landing page in Prediction Studio.
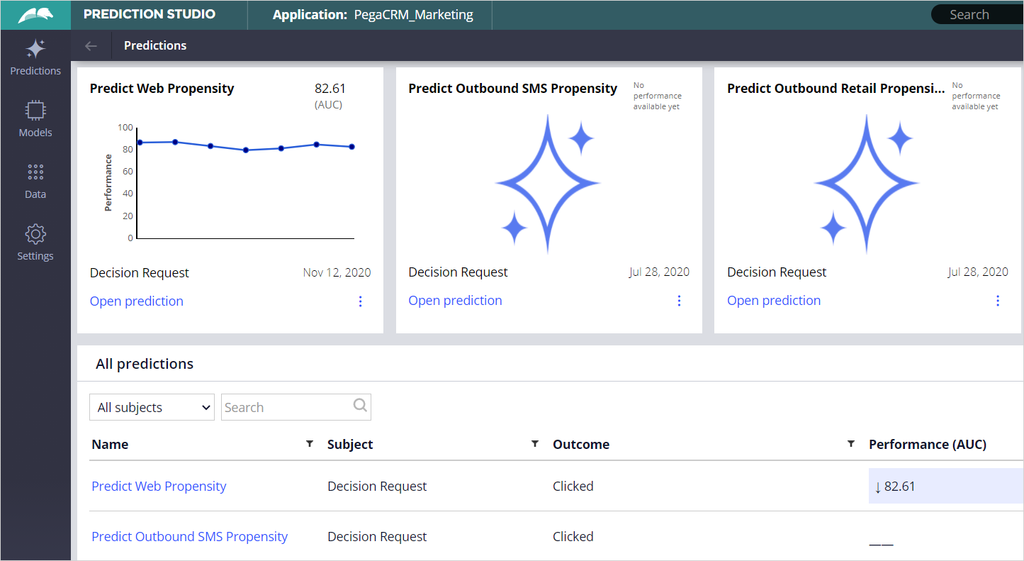
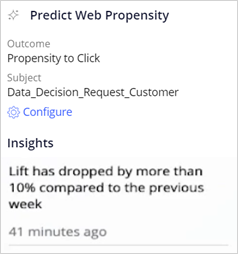
The Predict Web Propensity prediction monitors the responses from the U+ Bank website.
The outcome of this prediction is the propensity to click on a web banner.
A percentage of the total number of customers is randomly reserved for the control group.
The customers in the control group receive a random action instead of the action that the AI recommends.
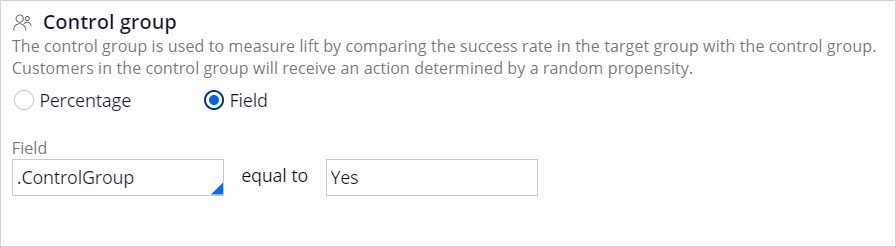
A small percentage is sufficient to measure lift. By default, the control group is set to reflect 2% of the population, but you can change that value if desired.
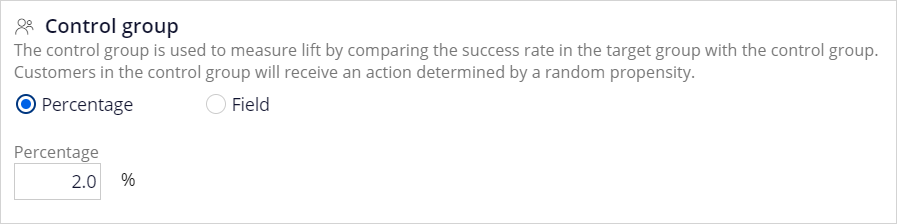
Alternatively, customers can be appointed to the control group based on a customer attribute.
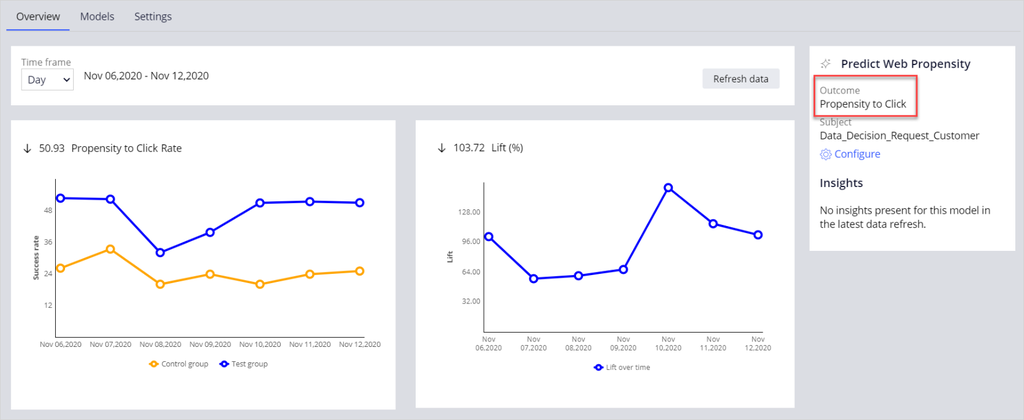
In the first chart, the yellow line shows the success rate, such as the accept rate, or, in the case of the Predict Web Propensity prediction, the click rate for the control group.
The blue line shows the success rate for all other customers, referred to as the test group.
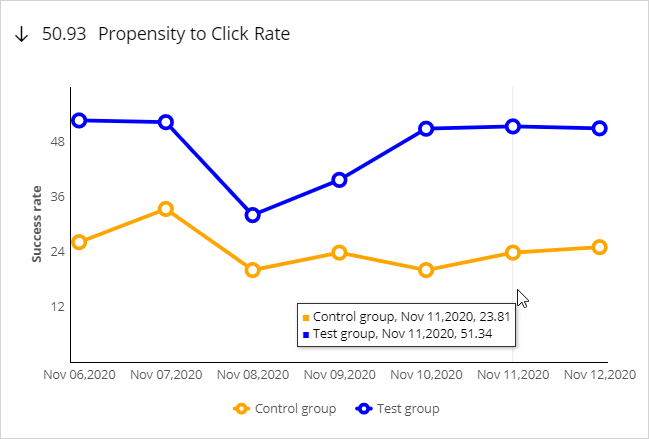
As customers in the control group are presented with a random offer, the success rate is expected to be lower than for the test group, for whom the offer is based on the propensity to click.
The second chart shows the lift over time, which is the difference between the blue and yellow lines, expressed as a percentage.
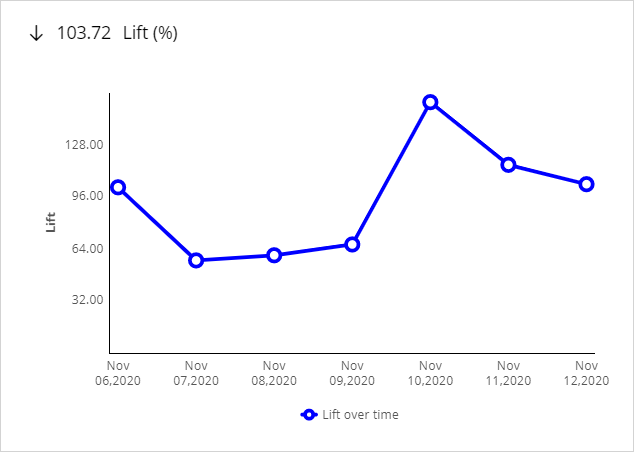
The use of a control group allows the measurement and monitoring over time of the efficiency of the machine learning process.
The control group also enables another data science best practice: mixing some exploration into the Prediction exploitation.
As the random offers made to the customers in the control group are not based on a particular customer profile, the models have a degree of freedom to explore.
In the notification section, two actionable insights related to lift are provided when applicable: absence of lift …
… and a lift that is significantly lower than in the previous week.
Both notifications prompt for an inspection of the model that drives the prediction as well as its predictors.
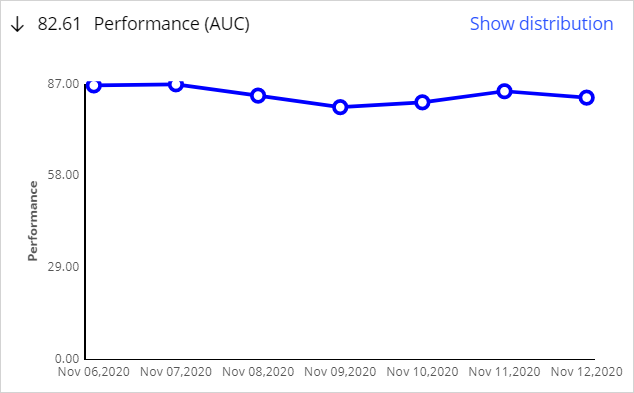
The third graph shows the performance of the model over time.
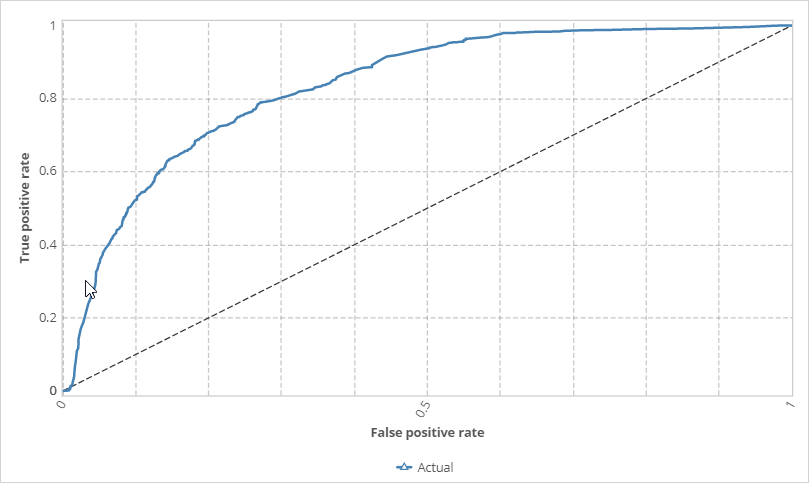
The ROC curve shows the true positive rate, or sensitivity, versus the false positive rate, or 1 minus the specificity, of the prediction.
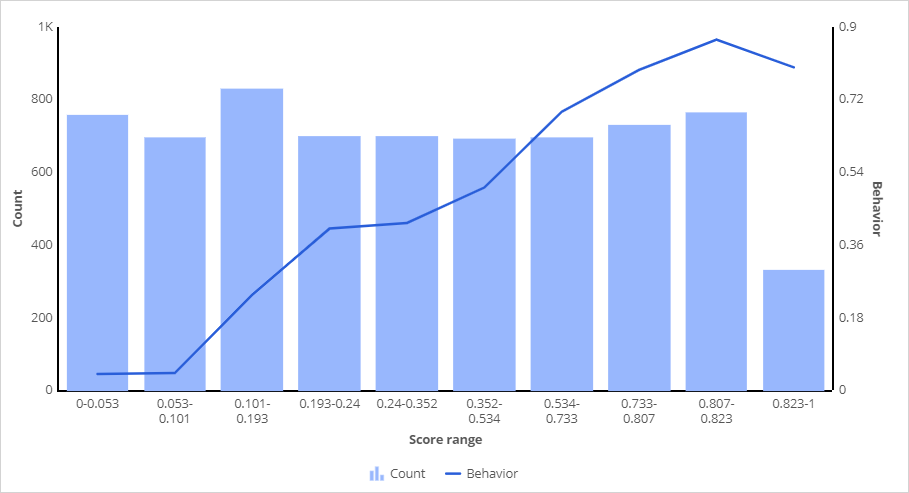
Also, a decile distribution graph is provided for further inspection.
You have reached the end of this demo. What did it show you?
- How predictions add best practices to predictive models.
- How the use of a model control group allows the measurement of lift.
- How the use of a model control group adds exploration to the exploitation of the models.
This Topic is available in the following Modules:
If you are having problems with your training, please review the Pega Academy Support FAQs.
Want to help us improve this content?