
Creating Insights for BAs
2 Tasks
25 mins
Beginner
Reporting
Constellation
English
Scenario
GoGoRoad stakeholders would like to know the number of Assistance Request Cases that have been requested over the past 30 days. The stakeholders requested that the Insights be made available in both table and chart-based form.
As a Pega Business Architect, you work with Business Analysts, SME, and System Architects to design Insights that allow stakeholders to analyze Case data in table and chart-based form.
User stories
As a Manager of the GoGoRoad Services team, I want to review both table-based and chart-based Insights that tracks the status of Assistance Request Cases over the last 30 days so that I can evaluate the revised assistance request workflow and make additional changes to the process, as needed.
Technical notes documented by the System Architect
- A table-based Insight named Number and status of requests submitted in the last 30 days shows all Assistance Request Cases created in the last 30 days.
- The table-based Insight includes the Case ID, Create date/time, Create operator name, Service type and Work status columns.
- The table-based Insight is grouped by the Work status field.
- The data in the table-based Insight is filtered by the Create date/time field for a time period of the last 30 days.
- A chart-based Insight named Number and status of requests submitted in the last 30 days shows all Assistance Request Cases created in the last 30 days.
- The chart-based Insight measures cases by the Case ID count.
- The chart-based Insight uses Create date/time and Work Status as the dimensions.
- The Create date/time dimension uses the Day part of the date to display the number of Cases each day.
- Both Insights are publicly available.
Note: Before you begin, generate 10-15 case instances with varying Case statuses.
The following table provides the credentials you need to complete the challenge:
| Role | User name | Password |
|---|---|---|
| Business Architect | author@gogoroad | pega123! |
Note: Your practice environment may support the completion of multiple challenges. As a result, the configuration shown in the challenge walkthrough may not match your environment exactly.
Challenge Walkthrough
Detailed Tasks
1 Create a new table-based Insight
- In the Pega instance for the challenge, enter the following credentials:
- In the User name field, enter author@gogoroad.
- In the Password field, enter pega123!.
Note: If your Pega instance for this challenge opens in the Auditor portal, in the upper-right corner, click A > Logoff.
- In the navigation pane of App Studio, click Explore Data to display the Explore Data landing page.
- In the upper-right corner, click the button, and then select Assistance Request to display data related to Assistance Request Cases.
- In the Available fields pane, under Assistance Request, click More fields to display additional available fields.
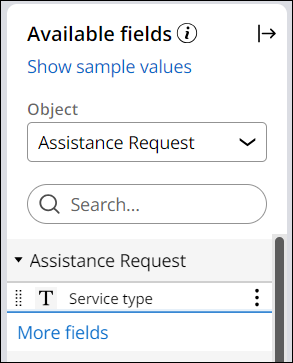
- In the Available fields pane, drag the Case ID field to the Data tab, and then drop it in the Columns section.
- Repeat step 5 for the Create date/time, Create operator name, and Work status fields.
- In the Available fields pane, drag the Work status field to the Data tab, and then drop it in the Groups section.
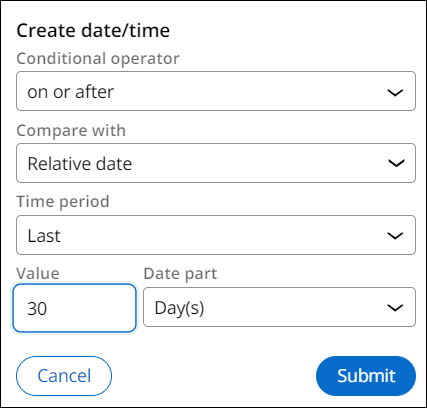
- In the Available fields pane, drag the Create date/time field to the Data tab, and then drop it in the Filters section.
The system displays the Create date/time dialog box.- In the first Conditional operator list, select on or after.
- In the second Compare with list, select Relative date.
- In the Time period list, select Last.
- In the Value field, enter 30.
- In the Date part list, keep the default value of Day(s).
- Click Submit.
- Click the Save as Insight button to display the Save as Insight window.
- In the Name field, enter Number and status of requests submitted in the last 30 days.
- In the Visibility list, select Public - All users.
- In the Description field, enter Assistance request cases for the past 30 days summarized in a table.
- Click Submit.
2 Create a chart-based Insight
- In the Number and status of requests submitted in the last 30 days Insight, click the Edit button.
- On the Data tab, in the Display as list, select Chart and then select Column.
- In the Available fields pane, under Assistance Request, click More fields to reveal additional available fields.
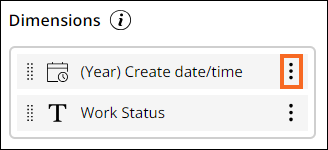
- In the Available fields pane, drag the Create date/time field to the Data tab, and then drop it in the Dimensions section above the Work Status field.
Note: The order of fields is important. In this example, the number of cases is first grouped by Create date/time, then by Work status.
- Click (Year) Create date/time - actions, select Date parts, and then click Day to display the number of cases for each day.
- In the Display as list, select Clustered Column to display both the number of cases by Create date/time and by Work status.
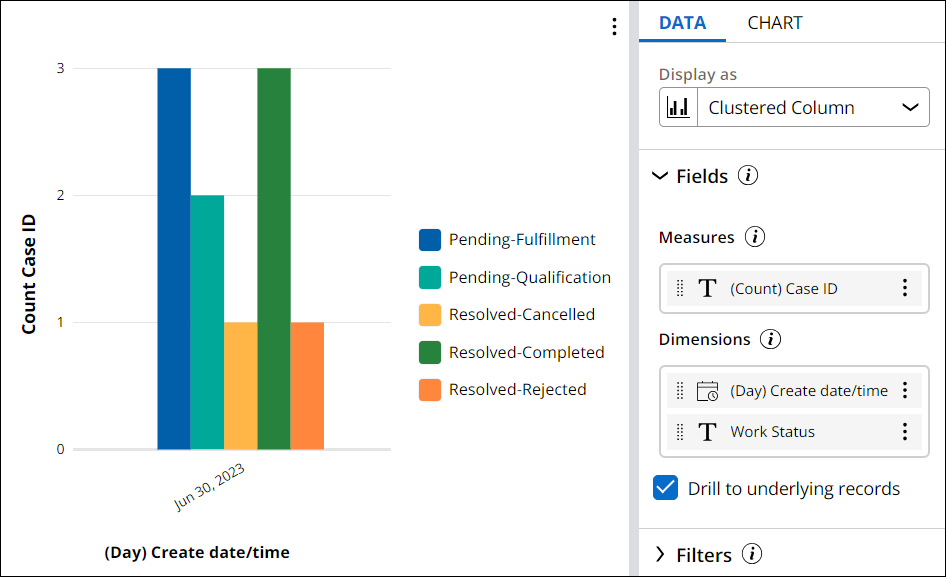
- Confirm that the Filters section has a filter called Create date/time >= Last 30 days.
- Click Actions > Save as to display the Save as Insight window.
- In the Name field, enter Number and status of requests submitted in the last 30 days.
- In the Visibility list, select Public - All users.
- In the Description field, enter Assistance request cases by day and work status for the past 30 days displayed in a Clustered column chart.
- Click Submit.
This Challenge is to practice what you learned in the following Module:
Available in the following mission:
If you are having problems with your training, please review the Pega Academy Support FAQs.
Want to help us improve this content?