Prioritizing actions using AI
4 Tasks
20 mins
Scenario
When customers log in to the U+ Bank website, they see the credit card offers for which they qualify based on the engagement policy defined by the bank.
When customers qualify for multiple credit card offers, AI decides which is the best offer to show.
The business understands how Pega Customer Decision Hub™ AI works in the context of a web channel. The predictive power of the adaptive models is at its highest when you include as much relevant, yet uncorrelated, information as possible. Adaptive Decision Manager (ADM) automatically selects the best subset of predictors. ADM groups predictors into sets of correlated predictors and then selects the best predictor from each group; the predictor with the strongest relationship to the outcome.
To complete the assignment, use the following credentials:
| Role | User Name | Password |
|---|---|---|
| Decisioning Architect | DecisioningArchitect | rules |
Your assignment consists of the following tasks:
Task 1: Ensure propensity in arbitration is enabled
In the Arbitration section of Next-Best-Action Designer, ensure the Propensity check box is enabled to ensure that AI is used in the arbitration process to select the top action.
Task 2: Log in as Troy to view the priority value of the top offer displayed
Log in to the U+ Bank website as Troy, but do not click the offer. Check the priority value of the top offer.
Note: The Priority value is used to prioritize actions and select the top action. The Priority value is the result of the Propensity*Context*Value*Levers (P*C*V*L) formula calculation.
Task 3: Check the propensity details of the actions that Troy qualifies for
Check the propensity details of the actions for which Troy qualifies. View the predictors that contribute to the final propensity of the next best action.
Task 4: Examine the AI model
Finally, examine the AI model behind the action or treatment in Pega Customer Decision Hub.
Challenge Walkthrough
Detailed Tasks
1 Ensure propensity in arbitration is enabled
- On the exercise system landing page, click Pega InfinityTM to log in to Customer Decision Hub:
- Log in to Customer Decision Hub as a Decisioning Architect:
- In the User name field, enter DecisioningArchitect.
- In the Password field, enter rules.
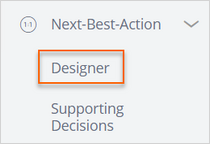
- In the navigation pane of Customer Decision Hub, click Next-Best-Action > Designer:
- In Next-Best-Action Designer, click Arbitration.
- In the Propensity section, ensure that the switch on the right is on:
Note: The arbitration formula uses the full PCVL formula. The propensity, the likelihood that a customer clicks on the banner, is just one component of the full Propensity*Context*Value*Levers (P*C*V*L) formula.
2 Log in as Troy to view the priority value of the top offer displayed
- On the exercise system landing page, click U+ Bank to open the U+ Bank website:
- On the U+ Bank website, in the upper-right corner, click Log in to log in as a customer.
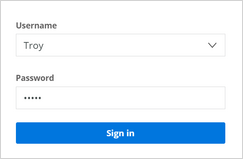
- In the Username list, ensure that Troy is the selection, and then click Sign in:
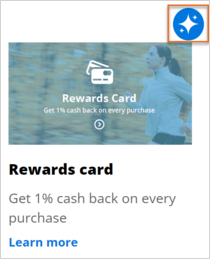
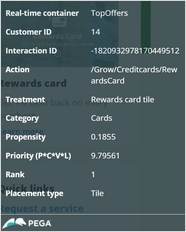
- On the offer, that is displayed for Troy, click the Polaris icon to view the Propensity and Priority values:
Note: The Polaris icon displays both the propensity value and the priority value, which is the result of the full P*C*V*L calculation.
The values that you see in your system can differ depending on the number of times you log in to the U+ Bank application.
3 Check the propensity details of the actions that Troy qualifies for
- Return to Customer Decision Hub, and then click Explore arbitration results to open Customer Profile Viewer:
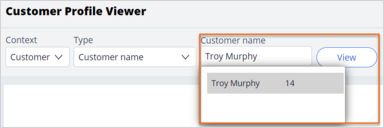
- In the Customer Profile Viewer, in the Customer Name field, enter or select Troy Murphy, and then click View:
- In the profile of Troy, click the Next best actions tab, and then set up the details to check the propensity:
- In the Direction list, select Inbound.
- In the Channel list, select Web.
- In the Real-time container list, select NextBestAction and then click Make decision:
- Confirm that Troy is eligible for two credit cards: Standard card and Rewards card:
Note: The ranking of the cards depends on the priority value.
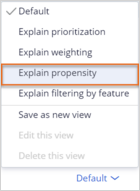
- Click Default > Explain propensity:
Note: The values in your system vary depending on the number of times that you log in to the U+ Bank application.
The final propensity is the propensity value that the system uses in arbitration. It can differ from the model propensity for new treatments when the model is still in an initial learning phase. This is because for new treatments there is some noise added to the propensity values of the raw model. When there is an increase in the number of received responses, the AI adds less noise to the propensity. The final propensity that the system returns is closer to the propensity value of the raw model.
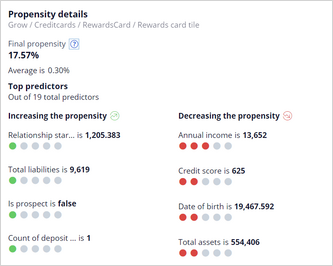
- In the row for the Rewards card, in the Final propensity column, click the Graph icon to view the propensity details:
- In the Propensity details window, confirm the following information:
- The value of the Final propensity section.
- The predictors that contribute to the increase (in green) and decrease (in red) in propensity:
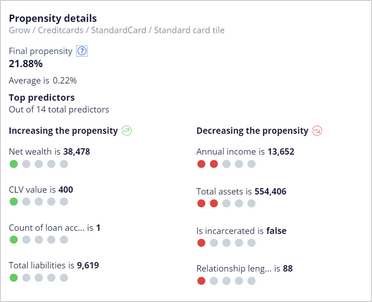
- In the row for the Standard card, in the Final propensity column, click the Graph icon to view the propensity details.
- In the Propensity details window, confirm the following information:
- The value of the Final propensity section.
- The difference in the predictors that contribute to the increase and decrease in propensity compared to the Rewards card.
AI selects a different set of predictors for the different models:Note: The AI does not select the Standard card as the Top Offer even though the propensity of this action is higher. It is because the action is selected by using the full Arbitration formula Propensity*Context*Value*Levers.
4 Examine the AI model
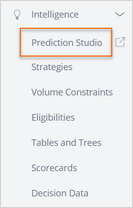
- In the navigation pane of Customer Decision Hub, click Intelligence > Prediction Studio to view the AI models in Prediction Studio:
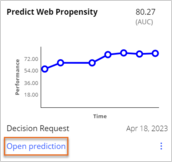
- In the Predictions window, click Predict Web Propensity > Open prediction:
- Click Models tab to view the AI models:
- Click the Web_Click_Through_Rate to open the customer treatment level model:
Note: Analyzing the AI models in detail is beyond the current scope of this challenge. For now, examine the list of predictors and the outcomes already configured by a Data Scientist.
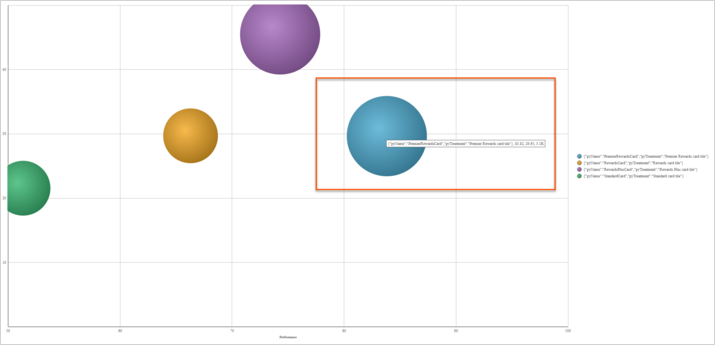
- Question: What is the model with the highest performance?
- On the models tab hover over the rightmost bubble:
Note: In the popup, you can see the name of the treatment model: Premier Rewards card, which has the highest performance: 83.82.
- On the models tab hover over the rightmost bubble:
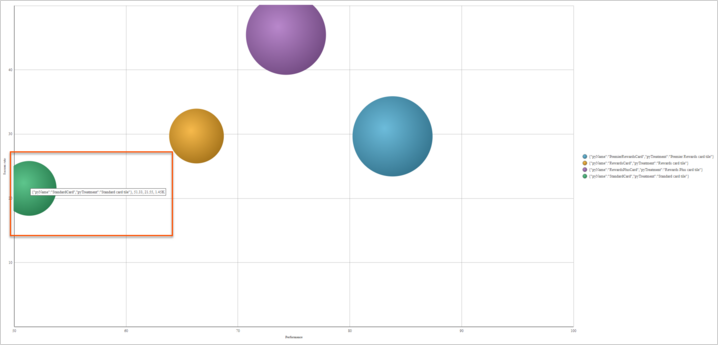
- Which is the worst-performing model and how many responses did it record?
- Hover over the leftmost bubble:
Note: In the popup, you can see the name of the treatment model: Standard card, which has the lowest performance: 51.33 and the volume of approximately 1500 responses.
- Hover over the leftmost bubble:
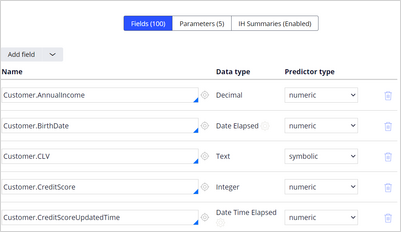
- On the Predictors tab, check the list of predictors configured at the time of creation of this model:
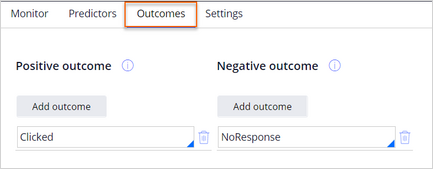
- On the Outcomes tab, check that the action outcomes are mapped to positive and negative behaviors.
- Check that Clicked is mapped to positive and NoResponse to negative:
- Check that Clicked is mapped to positive and NoResponse to negative:
- On the Monitor tab, open the Model Report for one of the models. For example: Premier Rewards card model:
- Question: What is the Annual Income range for which the propensity to click is the highest?
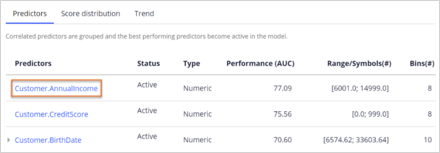
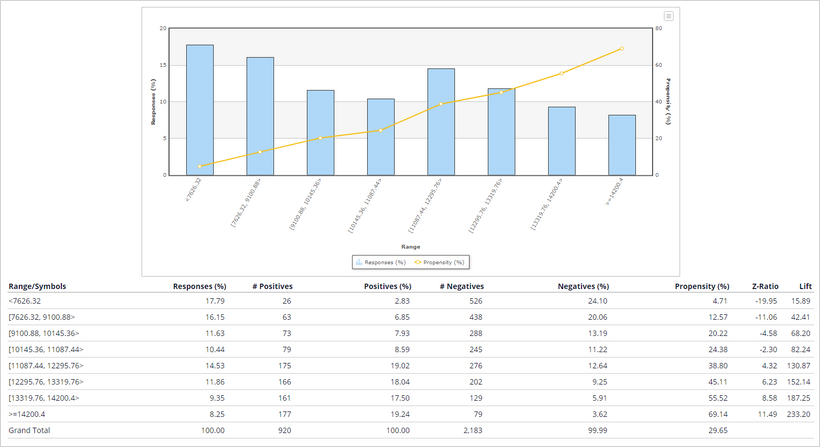
- On the Predictors tab, click on an Annual Income predictor to open it. Examine the unique values or number ranges in the predictor and the value or range with the highest propensity:
Note: In this case, as you can see in the graphic displayed, the propensity to click increases linearly with the Annual Income. The highest propensity in this example is 69.14 percent and it corresponds to the AnnualIncoma range: above 14.000.
These intervals are automatically generated by the AI model. The actual view of the predictors can be different depending on the data from your particular instance and the number of clicks that you made earlier.
- On the Predictors tab, click on an Annual Income predictor to open it. Examine the unique values or number ranges in the predictor and the value or range with the highest propensity:
- In the lower-left corner, click Back to Customer Decision Hub to return to Customer Profile Viewer in the Customer Decision Hub portal:
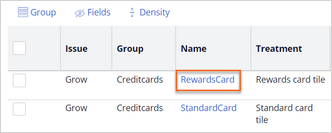
- Open one of the credit card actions displayed in Customer Profile Viewer:
- Click the Treatments tab:
- In the Web treatment, click the Polaris icon to see the active predictors:
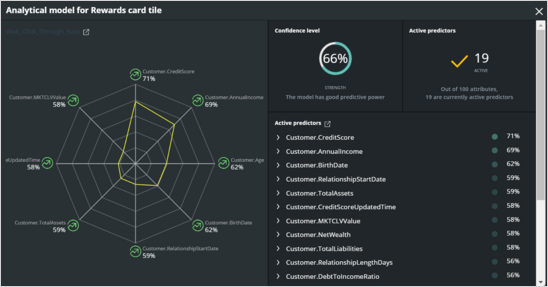
- In the Analytical model for Rewards card tile window, check the snapshot of the treatment-level AI model.
You can see the current confidence level in predicting customer behavior and the predictors used to make the predictions, as shown in the following example:
This Challenge is to practice what you learned in the following Module:
Available in the following mission:
If you are having problems with your training, please review the Pega Academy Support FAQs.
Want to help us improve this content?

