Adapter and event monitoring
When debugging a robotic solution using Robot Inspector, the Adapters tab lists all the adapters used in your solution and provides a live view of the matching status for each control in the adapter. The Events tab displays when selected control events occur to resolve any timing and availability issues found during debugging.
For example, you have a solution that waits for a web control to be created before entering data into a text box and clicking the search button. While debugging, you notice that the automation is not entering the data into the text box when the web page changes. You launch Robot Inspector and select the specific controls’ Created events to monitor in the Adapters tab. You debug the solution, review the Events tab, and determine that the order the events are occurring in is out of sync with your automation.
Adapters tab
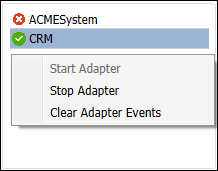
The Adapters tab lists all the adapters in your solution, allows you to start and stop an adapter to test how it runs, as well as navigate through the adapter’s application. Adapters are listed in the left pane of the Adapters tab. To start or stop an adapter, right-click on the adapter to display the Adapter context menu and select the necessary option.
When you select an adapter, Robot Inspector displays the interrogated target control hierarchy. Both, the left pane and the target control hierarchy display the matching status for the adapter and the adapter's interrogated controls. The green check means that the associated control is currently matched, and the red X indicates that the control is not matched. When Update live is selected, the matching status updates in real-time as Pega Robot Runtime matches controls.
Tip: You can manually update the matching status by clicking Refresh.
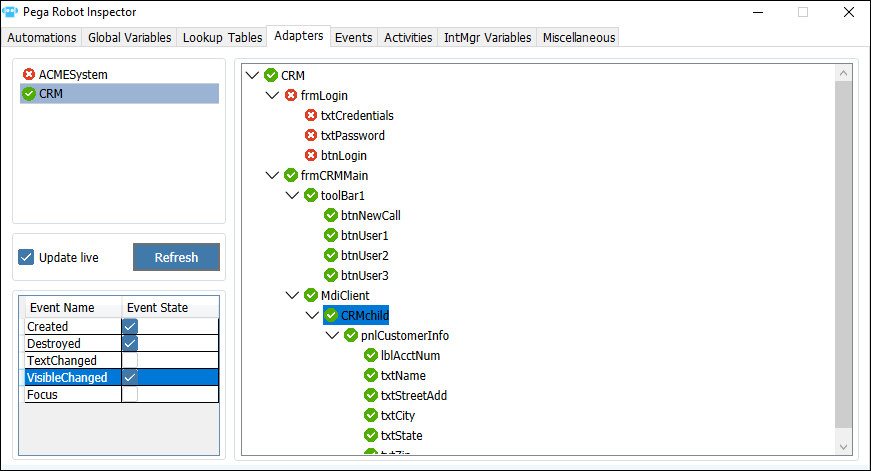
Selecting an adapter or an adapter control allows you to select events to be logged. After selecting events, such as Created, Destroyed, or TextChanged, to be logged for a specific adapter or control, view the order in which the selected events occur in the events log on the Events tab.
Events tab
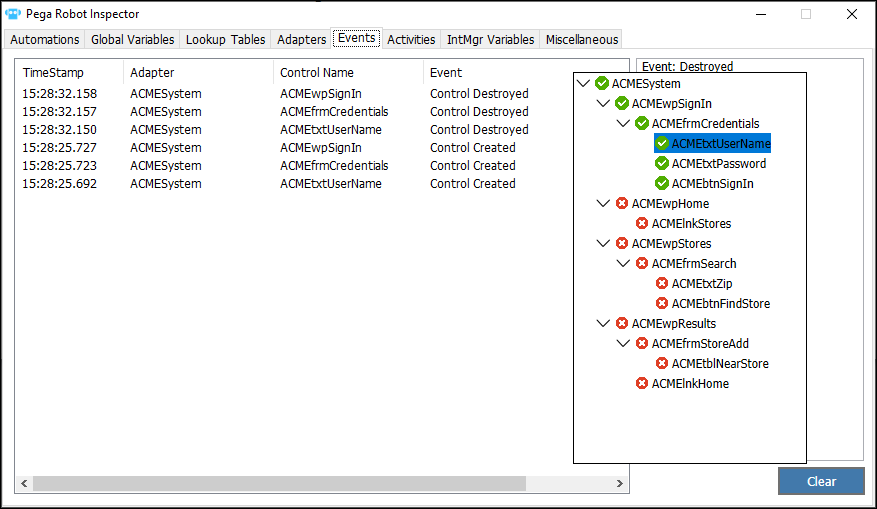
The Events tab displays the log of events selected on the Adapters tab. By reviewing the events, you can see the exact order in which a control or a group of controls are created and destroyed, or when a data value is modified, depending on the event state selected from the Adapters tab.
In Pega Robot Studio, controls are created from lowest to highest in the object hierarchy (child controls are created before parent controls) when you navigate to the page or screen on which they appear. Viewing the log and knowing the order of a control’s events helps you resolve timing issues to ensure that controls and data are available when needed for the automation.
This Topic is available in the following Module:
If you are having problems with your training, please review the Pega Academy Support FAQs.
Want to help us improve this content?