
Analyze application performance with PDC
Analyzing application performance with PDC
Pega Predictive Diagnostic Cloud™ (PDC) is a Software as a Service (SaaS) tool that runs on Pega Cloud® and actively gathers, monitors, and analyzes real-time performance and health indicators from all active Pega Platform™ applications. PDC gathers, aggregates, and analyzes alerts, system health pulses, and guardrail violations generated from Pega applications to produce trending dashboards. PDC empowers business stakeholders and IT administrators to take preventative action by predicting potential system performance and business logic issues and providing remediation suggestions.
PDC allows you to monitor several on-premise and cloud-based Pega applications. Systems running on Pega Cloud are already integrated with PDC. Pega applications send data to PDC. PDC does not request data from Pega applications. Asynchronous communication ensures a small performance impact on the monitored Pega system.
For more information about accessing and using PDC, see the Pega Community article Getting started with Pega Predictive Diagnostic Cloud.
Pega Cloud provides a URL from which you access PDC.
System Summary landing page
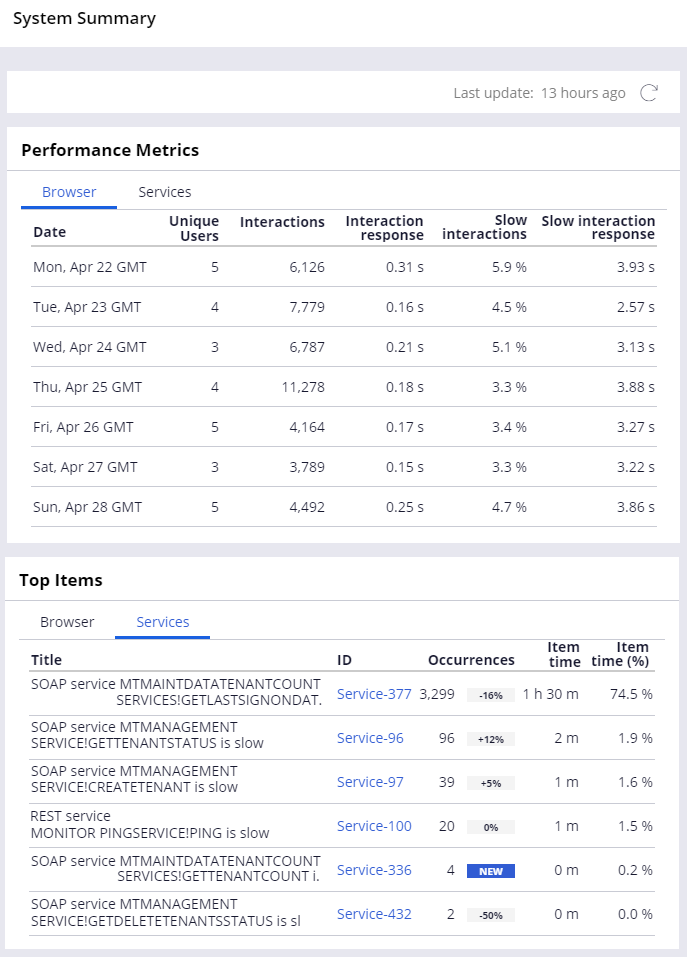
Click System Summary to open the System Summary landing page. The System Summary landing page provides an overview of performance metrics for monitored systems. Performance metrics are organized by browser or service. The landing page identifies Top Items, which indicate the most problematic areas in the system based on response time (item time), number of times the issue occurred in the past week (occurrences), and trend percentage (item time %).
Stability and Improvement Plan landing page
Click Improvement Plan to open the Stability and Improvement Plan landing page. The Stability and Improvement Plan landing page provides an overview of the issues that affect your system. The landing page provides information that helps you identify areas to target to improve system performance. Configure email notifications to receive detailed or high-level improvement plan reports.
In PDC, case types are categories of issues that can occur in your system. Case types include:
- Operations – High-urgency issues that you should resolve immediately
- Database – Issues that occur in your database configuration
- Pega Platform Tuning – Issues related to your Pega Platform configuration
- Connectors – Issues related to system connectors
- Decisioning – Issues related to Decision Strategy Manager (DSM)
- Exceptions – Issues related to run-time errors during Pega execution
- Application Logic – Issues related to the way the application is built
- Other – Issues related to any other type of problematic event
Each case type contains a list of issues, or cases. Expand each line item to see more details about the issue, including when the issue occurred and the number of occurrences.

Event Viewer landing page
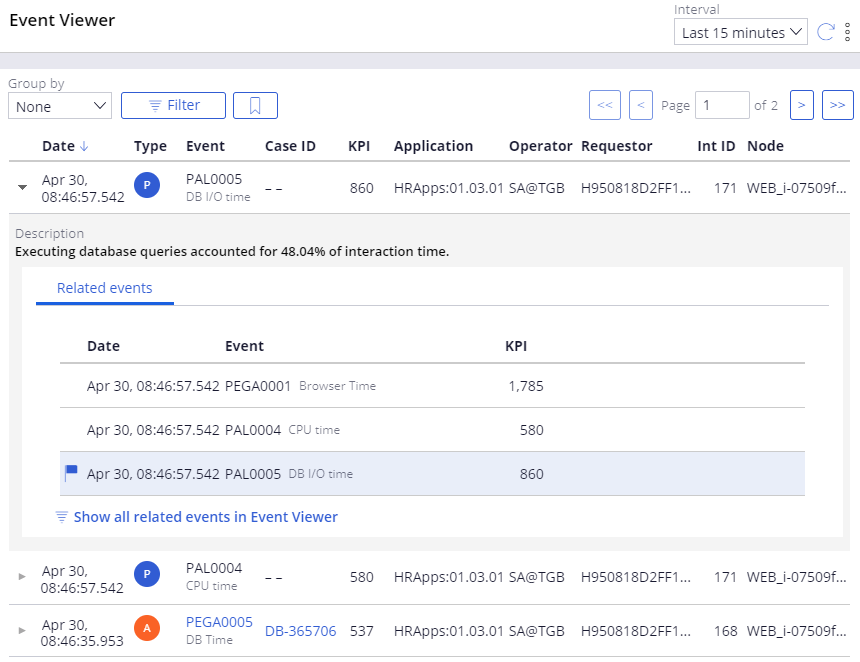
Click Event Viewer to open the Event Viewer landing page. The Event Viewer landing page displays a list of problematic issues in the system that occur during a selected time interval. The Event Viewer landing page is recommended for advanced users. Users can filter which events are displayed and expand each event to view more detail, including the event type, the key performance indicator (KPI) threshold, the activity that had the issue, and related events.
Data Collected by Pega Diagnostic Cloud
PDC receives, analyzes, and stores data sent from Pega Platform. Pega Platform only sends clipboard parameter data that is required for analysis and has known and safe content. Data with identifying information (for example, case data) is not sent due to privacy concerns. PDC cannot request information from the monitored application. Pega Platform gathers the following data for PDC:
- Alerts – Identifies the type of alert and metadata about what happened in an interaction
- Parameter page – Describes the parameters from the current parameter page, including important contextual information about the functions that run in the monitored application. All remaining parameters are filtered out and excluded
- Database alerts – Details the database query, excluding business data values
- Exceptions – Contains some contextual data that is a subset of the fields sent for alerts
- Performance statistics – Includes statistics for average response time and unique user count. PDC uses these statistics to identify overall performance and performance trends for monitored applications
- Database indexes – Includes database index information. PDC uses database index information to generate recommendations to improve query performance
- Guardrail violation counts – Counts the total number of rules with guardrail warnings, the number of rules with justified and unjustified warnings, and the number of rules based on warning severity (severe, moderate, informational)
KPI values
A system KPI is a measured value recorded by an alert. If the recorded value is higher than the KPI threshold configured in Pega Platform, the alert is triggered. Each alert maps to an action item type in PDC. When you elevate a KPI on an action item, all alerts with a lower KPI are ignored. Alerts with an equal or higher KPI are processed and assigned to an action item type. You can elevate the KPI on an action item in PDC.