Application performance issues
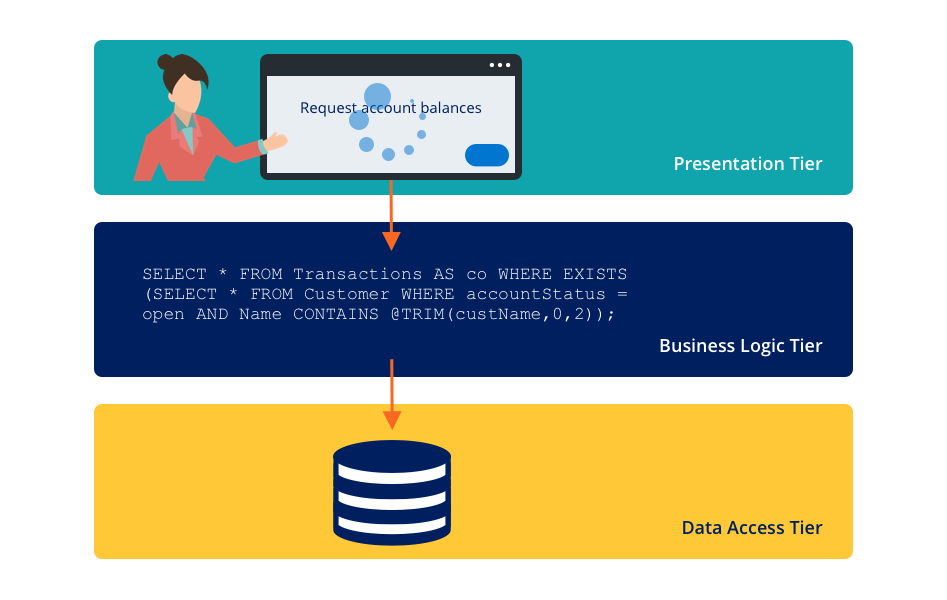
A system performance monitoring program includes monitoring environmental resources such as application JVM memory usage, application server CPU performance, database server performance, and application performance. An important first step to identify performance issues is understanding the multi-tier client-server architecture of Pega Platform™. The multiple handoffs among these application tiers can create difficulty in identifying the source of a performance issue.
Diagnosis of performance issues requires understanding the root cause of an issue. For example, users might report that an application takes a minute to render a form. A limited environmental resource, database interactions, or rules assembly might cause the issue. Pega Platform applications provide internal monitoring of performance and tools to identify common development and performance inefficiencies.
Design-time performance analysis
Poor application design can result in an application with performance bottlenecks that are difficult to diagnose and resolve.
Guardrails
Guardrails are application design best practices that help reduce the risk of introducing these types of issues. The best way to create a high-performance application is to follow guardrails and other design and implementation best practices throughout the development cycle.
Pega Platform monitors the rules that you create in your application for compliance with predefined guardrails. When you save a rule, Pega Platform performs a guardrail examination. If a rule violates a guardrail, Pega Platform applies a warning to the rule. This warning indicates the severity, the type of error that might result, a particular issue with the configuration of the rule, and often describes how to address the violation. Each rule can include multiple warnings.
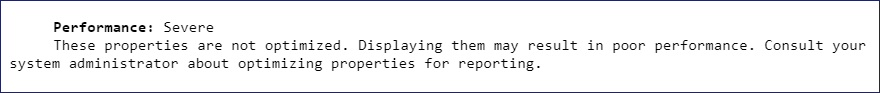
For example, a property that is embedded in the case data BLOB and not optimized for reporting can result in poor performance when executing a report. The system displays a guardrail warning message to alert you to the potential performance impact when you save a report definition that violates this best practice.
Pega Platform provides a compliance score that enables you to assess the overall quality of an application quickly. The compliance score is displayed in Dev Studio on the Application Guardrail landing page, which is accessed by clicking Configure > Application > Quality > Guardrails > Compliance Score.
In the following image, click the + icons to learn more about the compliance score.
Check the application compliance score and resolve guardrail warnings as you progress in development before moving to run-time performance analysis. The Compliance Details tab on the Application Guardrail landing page displays the specific performance risks, including the number of severe warnings to address immediately and the moderate warnings to resolve before production.
Tip: On the Application Guardrails landing page, use the Schedule report option to regularly send stakeholders the compliance score to help ensure the score remains above a certain threshold.
Because new releases of Pega Platform add new guardrail validations and warnings, reassess guardrails or revalidate rules following an application update. When a client application updates to a newer release, any new guardrail best practices do not automatically apply to rules that already exist in the application. Pega Platform provides a feature to revalidate rules by ruleset, so the new warning is applied to old rules.
Note: To learn more about executing the revalidation process, see About the bulk Revalidate and Save tool.
Check your knowledge with the following interaction:
Run-time performance analysis
System performance has many dimensions, so it is important to determine goals and measures of success as the first step in performance testing analysis. For example, an end user might believe that system performance is determined by the response time, while a business might believe system performance is determined by throughput.
Pega Platform generates system alerts at run time based upon various performance thresholds you set in the prconfig.xml file or Dynamic System Settings. The alert is a text entry or message indicating that a specific interaction or rule execution has exceeded a performance threshold. The message also identifies the type of requestor (for example, browser or batch requestor) and the activity or stream that triggered the alert.
Caution: Cloud customers do not have access to modify the prconfig.xml file. Instead, Cloud customers use the Dynamic System Setting option to implement performance alert thresholds.
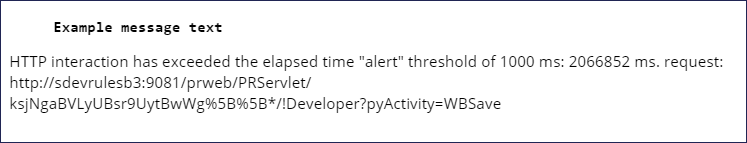
The following example of message text illustrates a threshold violation alert:
Pega Platform writes the alerts to the performance alert log during application processing. You can view the Logs landing page in Dev Studio by clicking Configure > System > Operation > Logs, and then view the alerts page by clicking Alert. Pega Platform also offers the Predictive Diagnostic Cloud (PDC) monitoring application to capture, analyze, and manage alerts. This application greatly enhances monitoring features by providing a health-check dashboard, enhanced analytics, and database table index recommendations.
Check your knowledge with the following interaction:
Identification of performance issues by using alerts
Identifying the cause of performance issues in an application can be challenging. An application can present various performance issues such as excessive response times, lengthy request result sets, invalid data returns, database deadlocks, and too many open connections. For example, performance issues such as excessive response times may be caused by a poorly written SQL query in the application, network latency, or performance issues with the database server.
Performance alerts can also help you to identify the root cause of a performance issue. You can use a combination of alerts to identify the pattern or cause for a specific alert to appear frequently. For example, the alerts in the following table can help you identify the cause to troubleshoot an excessive response time issue.
Common alerts include:
| Error number | Error name | Reasoning |
|---|---|---|
| PEGA0001 | HTTP interaction time exceeds limit | Exceeding a time threshold for long-running calculations, waiting for database connections or responses, or waiting for information from an external service |
| PEGA0002 | Commit operation time exceeds limit | Exceeding a time threshold for a database commit operation |
| PEGA0004 | Quantity of data received by database query exceeds limit | Exceeding a byte threshold when a query loads an excessive quantity of data |
| PEGA0005 | Query time exceeds limit | Exceeding a time threshold for a query to run |
| PEGA0026 | Time to connect to database exceeds limit | Exceeding a time threshold to connect to a database |
| PEGA0030 | The number of requestors for the system exceeds limit | Exceeding a numerical threshold for the number of requestors |
Note: To view a complete list of alerts and more details about each, see List of performance and security alerts in Pega Platform.
Adjustment of performance alert thresholds
In a development environment, some performance alerts are transient and caused by tasks that do not occur in a production environment. However, many performance alerts that are triggered in a development environment provide an early warning that a recently executed rule, or a combination of rules, exceeds established performance thresholds.
Application performance has many dimensions, so it is important to determine the goals and measures of success as the first step in performance improvement efforts. Load testing often identifies performance issues before the issues occur in the production environment.
Some changes to performance thresholds provide clear advantages. For example, reducing the number of rows that are retrieved from the PegaRULES database reduces the number of bytes that are sent over the network. It likely reduces the amount of memory needed to store the data on the server. Other changes may involve tradeoffs. For example, reducing demand for one type of resource increases the demand for another type of resource, which improves performance by one measure but harms performance from a different measure. Identifying performance degradation and opportunities can take research. Improving one lightly-used task to 200 percent faster speed is impressive, but the task may have a minor overall impact than a 2 percent improvement in a vital, heavily used task.
Performance alert thresholds have default values that might not be explicitly set in the application. The preferred method for adjusting performance thresholds is by using dynamic system settings (DSS), but you can modify the system settings in the prconfig.xml file. You can maintain alert thresholds in the prconfig.xml. However, current versions of Pega Platform are enhanced, so alert thresholds are maintainable with the use of DSS instances, as long as the prconfig.xml has the following parameter name and value set to <env name="initialization/settingsource" value="merged" />.
Caution: Cloud customers do not have access to modify the prconfig.xml file. Instead, you use the Dynamic System Setting option to adjust performance alert thresholds or contact Pega Cloud Services to directly update settings in the prconfig.xml file.
Note: To set an alert threshold with a Dynamic System Settings record, prepend prconfig/ and append /default to the setting purpose. If a prconfig setting is defined in a prconfig.xml file and defined through a Dynamic System Setting, the prconfig.xml takes precedence.
In the following image, click the + icons to learn more about defining a DSS record for performance thresholds.
Note: You need to restart the application server before changes to performance-related DSS entries take effect.
For example, you are interested in identifying database queries that return large amounts of data. The byte threshold feature is disabled by default. In the following image, click the + icons to learn how to configure byte thresholds.
Check your knowledge with the following interaction:
If you are having problems with your training, please review the Pega Academy Support FAQs.
Want to help us improve this content?