Background process management
Background process management
Queue processors and job schedulers can fail to process items correctly for a number of reasons. For example, the processes are unable to obtain a lock on an entry because they lack security access or an activity or related class is named incorrectly.
Queue processors queue objects and then process them. As shown in the following image, if the process fails and the system cannot commit a queue entry, the system puts the entry into failure status and indicates the process is broken. The system also reverses any changes the process initiated.
In Admin Studio, you use the Queue processor landing page to trace and monitor Queue Processor rules in your application. If there is an error, users with the SysAdmin4 role can troubleshoot issues with the queue processor by tracing the running processes and examining the items in the Broken queue.
The job scheduler triggers items to process at pre-configured times. It does not queue items. To troubleshoot issues with job scheduler processes, you can run a trace on the failing processes. You can also configure the Performance tool to manage statistic aggregation for job scheduler rules. For more information on configuring the performance tool for job scheduler statistics, see the help topic Configuring the Performance tool for Job Scheduler rules.
Admin Studio: Overview landing page
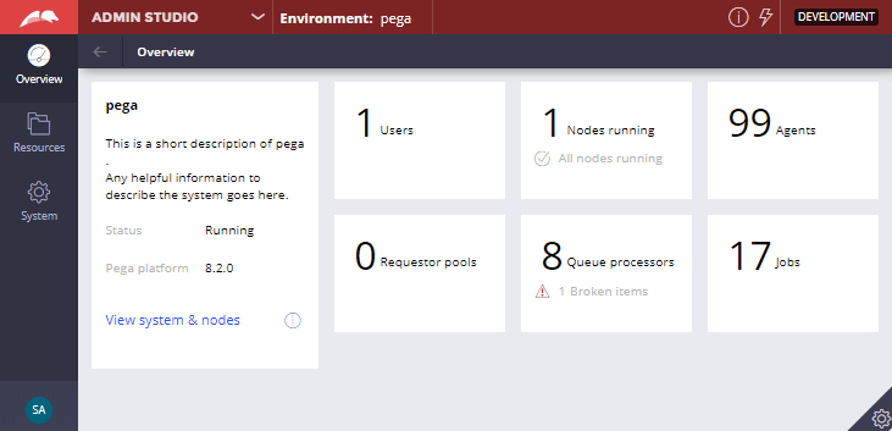
The Overview landing page of Admin Studio contains information that you need to monitor queues. As shown in the following image, you can access system and node classification details, queue processors and scheduled jobs. Each tile lists the number of configured instances. For example, the Queue processors tile shows that there are eight queue processors and all activities are running. There is one broken processor. Clicking each tile opens the corresponding landing page.
Queue processors and job schedulers must be enabled in the system. If you do not see a queue processor or job scheduler in Admin Studio, you may have to enable the system to find it. You configure the ASYNCPROCESSOR requestor type to include an access group with access to the application. The requestor type is accessible from a link on the queue processor or job scheduler rule form. The queue processor or job scheduler start after adding the access group to the requestor type. At that time, you can monitor the queue processor or job scheduler from Admin Studio.
Tracing of queue processor rules
You can use the Queue processors page to trace, start and stop queue processors. Tracing processes enables you to examine issues such as failed activity steps that may prevent the processor from committing an entry. You can trace processing throughout the system. You can trace a processor only while it is running. You can analyze the results of tracing to identify and fix issue with queue processor rules.
Follow these steps to start a processor trace.
- In the sidebar menu of Admin Studio, click Resources > Queue processors to open the Queue processors page.
- On the row with the queue processor you want to trace, click the Actions menu icon to open the actions menu.
- On the Actions menu, click Trace to begin the trace.
Note: Tracing the pzStandardProcessor queue processor requires an additional step. You must specify the activity to run after clicking Trace from the Actions menu and then click Open tracer to begin the trace.
Examine processors
You can view advanced statistics on each queue processor by viewing the data flow.
Follow these steps to view the data flow for a queue processor.
- On the Queue processors page, click the Actions menu icon to open the actions menu for the processors.
- Select View Data Flow to open the Data Flow Work Item for that processor in Dev Studio.
The following image shows basic data about the pyBatchindexProcessor. You can view run warnings, duration, start time, number of processed records and average processing time.
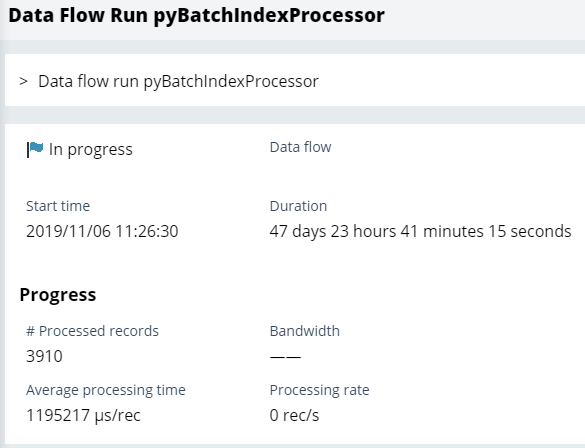
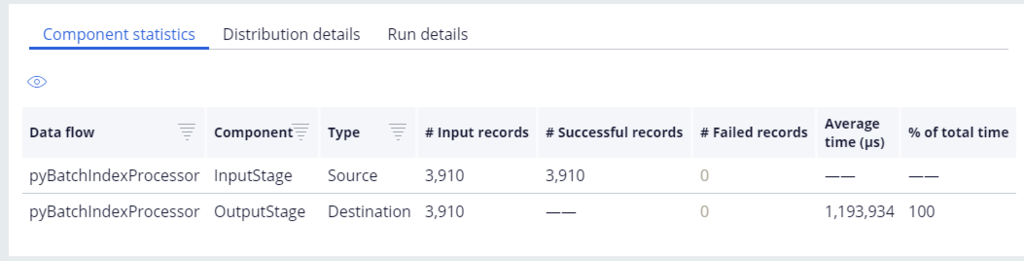
Below the basic information are three tabs, Component statistics, Distribution details, and Run details. These tabs provide more complex information to help you troubleshoot the processor.