The Database Trace
The Database Trace produces a text file containing the SQL statements, rule cache hit statistics, timings, and other data that reflect the interactions of your requestor session with the Pega Platform™ database or other relational databases. A basic familiarity of SQL Operations, (for example read, write, and insert), and BLOB is useful to interpret the output.
The Database Trace is available on the Performance landing page in Dev Studio (Configure > System > Performance > Database Trace) or from the Performance tool in the toolbar.
Operating the Database Trace tool can adversely affect performance by producing a large volume output. Use the tool for short periods, in non-production environments appropriate for debugging.
Check your knowledge with the following interaction.
Configure the Trace settings
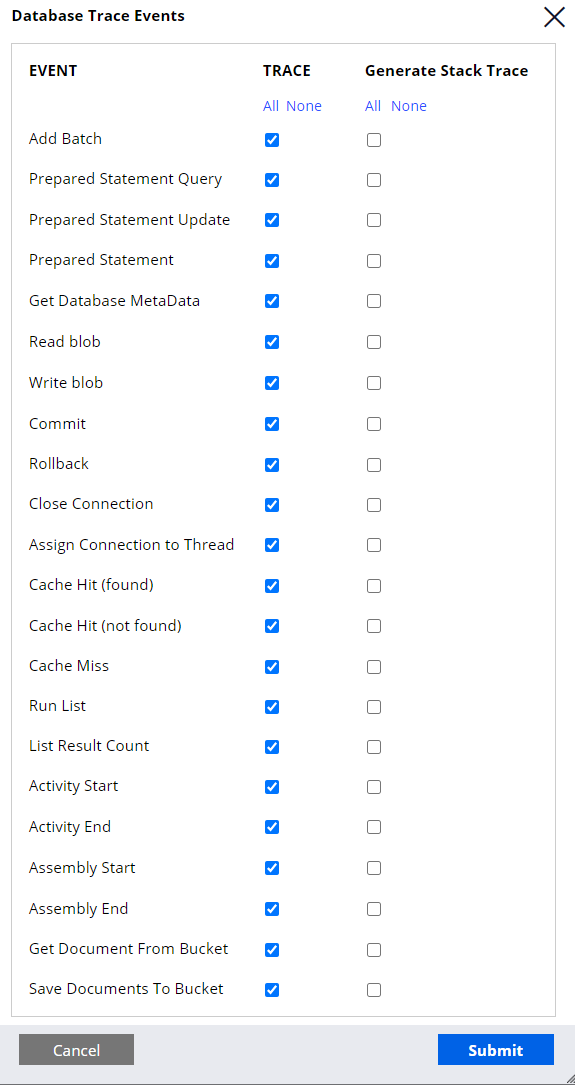
Click Trace Options to open the settings window. The settings window lists all possible events to trace. If an event is inapplicable to a situation, remove it from the list to streamline the results. You also have the option to generate a stack trace. Generating the stack trace is an expensive process and should only be used when required.
Generate Trace
In the following image, click the icons to learn more about generating a database trace.
Note: In this example, the Performance landing page was used to access and run the Database Trace.
For more information on how to start a database trace, see the Pega Community article Starting a database trace.
Download data and interpret readings
If database operations, such as queries or commits, take a long time to process, the DB Trace can help determine the source of the performance issue. For example, if you have a query that is taking a long time to process, you can review the Database Trace details in a spreadsheet to investigate the operations that took the most time.
Downloaded data contains a sequential progression of trace events. In the following image, click the icons to learn more about some of the important fields in the trace. Some spreadsheet columns are hidden in order to showcase the most useful fields.
For more information on how to view database trace results, see the Pega Community article Viewing database trace results in Excel.
If you are having problems with your training, please review the Pega Academy Support FAQs.
Want to help us improve this content?