The Performance Analyzer (PAL)
Analyzing application performance with the PAL tool
The Performance Analyzer (PAL) provides a view to all the performance statistics that Pega Platform™ captures. Use PAL to understand the system resources consumed by processing a single requestor session.
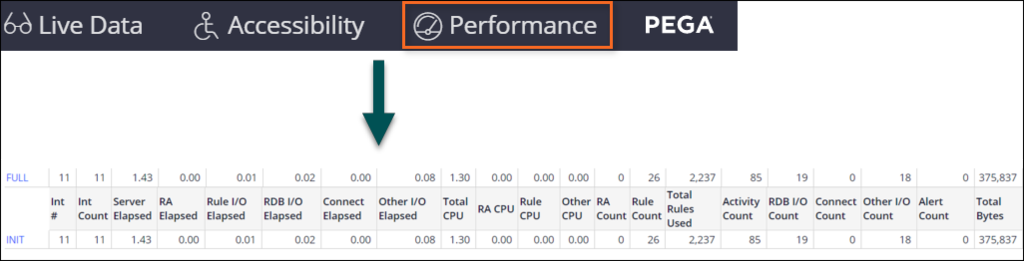
PAL is available on the Performance landing page (Dev Studio > Configure > System > Performance) or from the Performance tool in the toolbar.
Measuring performance
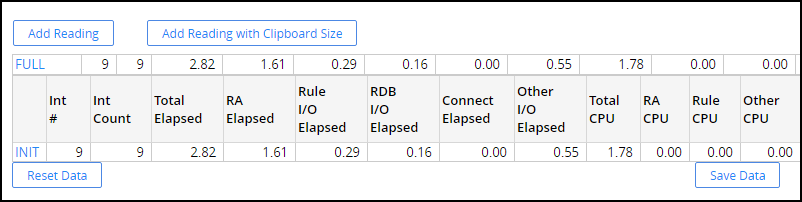
The first step to measuring your application performance is to take measurements. Start by clicking Reset Data to clear any data in the tool. Since the system is continuously monitoring performance, you are eliminating any previously recorded entries from your results by resetting data.
There are two options for adding a reading: Add Reading and Add Reading with Clipboard Size. The only difference between the two readings is the addition of the clipboard size, which takes extra time to calculate.
When adding a reading, the best practice is to define points that identify what occurred during that reading. For example, use one reading per flow action or screen render, depending on what process you are measuring.
Click Save Data to download the results to an Excel file.
To learn more about the system utilization for a requestor session with Performance Analyzer, see the Pega Community article Tracking system utilization for a requestor session with Performance Analyzer.
Summary display
The INIT row displays the totals from the first time the Performance tool made a reading. Each subsequent reading is labeled as a DELTA — this indicates the change from a previous reading. The FULL reading is the total sum of all the statistics from the last time the data was reset.
In the following image, click + to learn more about the PAL summary display.
To learn more about the summary display of Performance Analyzer, see the Pega Community article Using the summary display of Performance Analyzer.
Analyze performance data
Clicking INIT, DELTA, or FULL displays more details about the reading. Many different results are available to you for analyzing the performance.
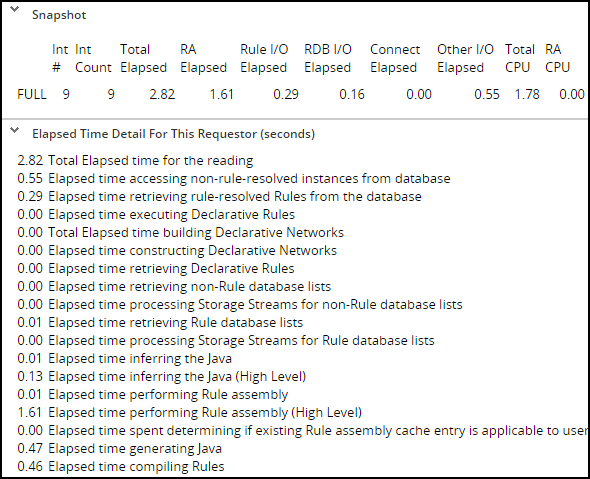
In the following two images, which represent a single reading, the top delta has a reading of 1.61 for RA Elapsed. All values are in seconds. RA Elapsed represents the time spent in rule assembly. These results can skew performance readings as rule assembly, also known as first use assembly (FUA), is expensive and only occurs once. This is evidenced by the following results. The total elapsed time was 2.82 seconds, with 1.61 seconds of that time spent in rule assembly. Without the additional 1.61 seconds, the total time would be less than half the measured number. FUA also affects other readings such as the total rules executed, the reads from the database, and various I/O counts.
To obtain results unaffected by FUA, run through the process once to ensure all rules have been assembled before taking any measurements. That was not done in the above example in order to demonstrate the impact this has on performance readings.
The readings are grouped into three different types signified by the following keywords in their labels.
- Elapsed is the system time, in seconds, that a process takes; this time includes the CPU processing time. Thus, this time is generally equal to or longer than the CPU time. For example, Elapsed time compiling Rules measures the amount of elapsed (system) time the system takes to compile the generated Java code for a Rule.
- CPU is the amount of CPU processing time for the current action in seconds. For example, CPU time compiling Rules measures the amount of CPU time the system takes to compile the generated Java code for a Rule.
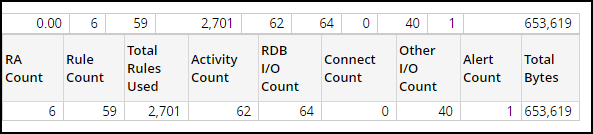
- Count is a count of the number of times a specific action occurs. For example, Activity Count gives the number of activities started by a thread.
For more information on the details displayed on the performance report, see the Community article, Using the full details display of Performance Analyzer.
A result of 10 minutes may be acceptable in one situation, whereas a result over 100 milliseconds is considered too slow in another. You must work with the Lead System Architect and the Business Architect to determine an acceptable result for each step of the process.
If you are having problems with your training, please review the Pega Academy Support FAQs.
Want to help us improve this content?