Diagnosis of database issues
Database issues can impact application performance. Often, it is the manner in which the database is accessed and used that causes performance issues. To find the root cause of a database performance issue, analyze data access patterns and transactional boundaries for how they affect your data models.
For example, performance issues might be caused by:
- Database table size.
- Too many indexes.
- Reading a BLOB.
- Poorly written SQL statements and queries.
Database related performance issues may have multiple causes. A mobile app, with many resolved cases, that performs a non-case-sensitive query on a case-sensitive field has a large table size and a poorly written query.
Note: As a best practice, create indexes on key data columns to support your application design.
Check your knowledge with the following interaction:
Database issue diagnosis
Database issues can manifest as slow application performance. Before you diagnose database issues, obtain specifics about the symptoms. Ask the user that reports the slow performance to describe the circumstances that precede the slowness. For example, users may see slow performance when opening a form for a customer call, but other processes have no perceived slowdown.
Diagnose database issues by using the Performance tools that are available in Dev Studio.
Note: Consult a database administrator (DBA) before altering the database schema by exposing properties or creating new database tables and moving records.
Diagnose issues with Performance Analyzer (PAL)
To diagnose performance problems caused by database issues, select Configure > System > Performance > Performance Analyzer (PAL). By running PAL and taking incremental readings for each form, you can identify where in a process the issue occurs, and then drill into the summaries for the step.
You can also check the My Performance Details report for the user experiencing the issue. The My Performance Details report provides a PAL-like snapshot of what happened to a specific user during a specific session. The report is available by clicking Configure > System > Performance > My Performance Details. On the report, change the operator ID to view the session data for the appropriate user.
In the following image, showing the FULL view of the Requestor Performance Analyzer, click the plus + icons to view the kinds of information you can use to identify potential performance issues:
Note: To learn more about PAL Snapshot, see Viewing detailed performance statistics for requestor sessions.
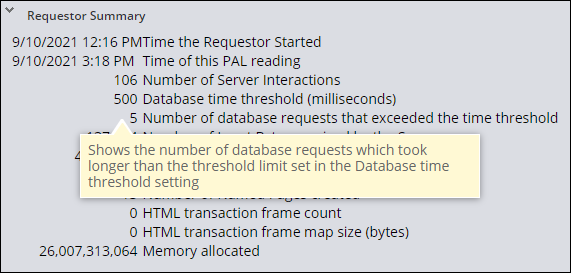
View performance statistics in context. Consider how often and in what circumstances the issue occurs. For example, 45 requests that exceed a threshold in a pool of 10,000 interactions is less significant than 45 requests that exceed a threshold in a pool of 70.
The following image shows an example Requestor Summary in the PAL details Snapshot. Notice the number of server interactions, the database time threshold, and the number of database requests that exceeded the time threshold. In this example, approximately five percent of the database requests exceeded the time threshold.
Note: An alert exists for each threshold violation. Alerts provide notice of violations, but they do not always provide the cause.
Diagnose issues with Database Trace
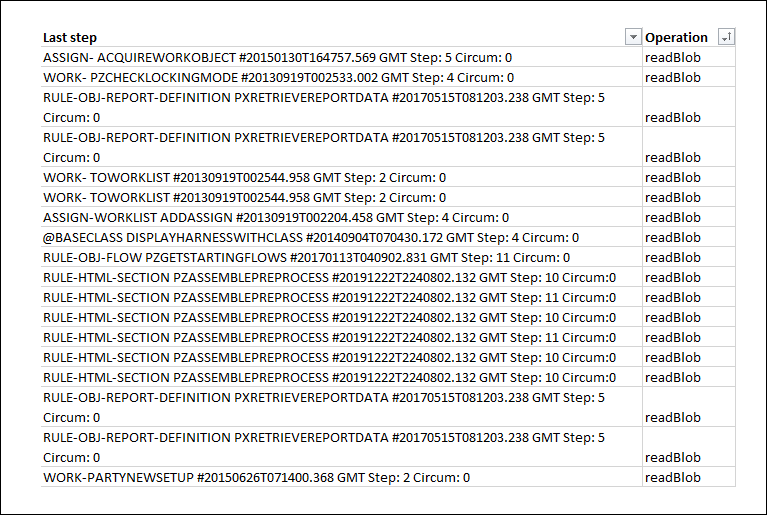
You can also use Database Trace to examine a query made to the database. For example, in Dev Studio, click Configure > System > Performance > Database Trace, and then sort the results by the readBlob operation to identify the operations that read data from a BLOB. Remember to look at rules in application rulesets to ensure that the correct rule is referenced.
The following image shows the results of a Database Trace that shows all readBlob operations.
Best practices to address issues
Frequent performance testing allows you to resolve issues early based on the results of your diagnosis. Review the details for tuning performance based on the type of issue that you find.
Large database table issues
Large database tables impact performance through sheer volume. The larger the database table, the longer it takes to access data from the database. For example, an insurance company processes hundreds of claims a day. The group of resolved claim cases becomes substantial. Within a year, case workers experience a slower-than-normal response time when searching for open cases.
Options to address large database tables include:
- Create database table records for one or more classes in the class group if the large table maps to a class group. For example, an application creates five types of cases. Half of the cases created are of a single case type. Assigning a separate database table for the most-used case type reduces the table growth rate of the class group. To learn more about class groups, see Working with class groups.
- Create a database table record to map the instances of one or more specific classes to a different table if the table is
pr_other. Then, move the class instances frompr_otherto the appropriate table. Use of thepr_othertable triggers a PEGA0041 alert and a guardrail warning and is best addressed in development. - Enable paging on list reports to improve report performance. Paging limits the number of results that are displayed by a list report to the specified page size you configure. Paging also reduces the clipboard size and the time needed to display each results page. Users can move to the next page to view more results.
- Index key data columns.
- Archive data that is no longer needed.
BLOB issues impacting database size
Reading from a BLOB impacts performance by requiring an application to allocate memory to decompress a BLOB and extract the necessary data. Requests that require the application to read an entire BLOB, decompress it, extract the required property, and then discard a BLOB take more time than requests to read the value from a column in the database table.

For example, a data page might source data by using a report definition that queries the database for a list of values to display in a drop-down list. Reading data that is stored in a BLOB can lead to query times that exceed established performance thresholds and trigger performance alerts such as PEGA0005: Query time exceeds limit.
When addressing a BLOB issue, the first step is to determine if a property needs exposure in its own column. Avoid exposing properties until you assess the performance impact of reading from a BLOB. Using a BLOB reduces the size of table rows by compressing unexposed data. Exposing properties unnecessarily can increase database table size.
SQL query issues
Poorly written queries impact performance by forcing Pega Platform™ to read items from the database unnecessarily. Improperly written queries tend to occur in either SQL connectors or reports (for example, a SQL rule that performs an unnecessary case-sensitive query).
If the Database Trace reports that a particular query is taking a long time, look at the SQL query construction. You copy the query from the Database Trace data, along with the substitution values, and then use the native tools for your database to analyze the query and look for ways to optimize the query.
View the following table for solutions to potential issues.
| Potential issue | Potential solution |
|---|---|
|
SQL query that uses a |
Consider a less-costly condition such as starts with. |
SQL query contains insert or update statements |
Investigate storage optimizations. |
| Extraneous indexes | Too many indexes may slow down the insert/update statements and worsen performance. Ensure those indexes are required. |
| SQL query joins two tables | Improve performance by creating a Rule-Declare-Index, which automatically maintains index instances for faster access. For more information on Declare Index rules, see Configuring Declare Index rules. |
| Query response time | Make sure that the database query response time falls under the service-level agreement (SLA) that is defined by Pega Platform alerts and tune them if required. Also, look for other database-related alerts in Predictive Diagnostic Cloud (PDC). For more information on PDC, see Predictive Diagnostic Cloud. |
| Column data | Make sure that your database query retrieves data from the right columns and not more than the required columns. |
| Multiple runs | Make sure that the same database query is not run multiple times or repeats more than required; you can check this by tracking the count of executions in PDC or PAL readings. |
Note: As a best practice, find the top complex queries for response times (RDB I/O Elapsed) and counts (RDB I/O Count) and address them.
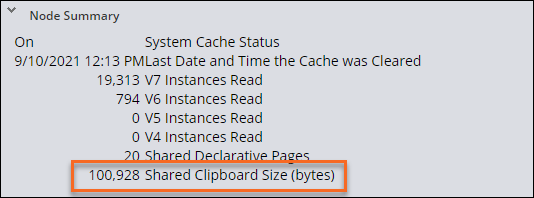
Clipboard size
One of the causes of performance issues is how large database tables affect the clipboard. A large clipboard size negatively affects performance because memory in Pega Platform holds the clipboards of all requestors. Paging limits the number of results that are displayed by a list report to the specified clipboard page you configure. Paging reduces the clipboard size and the time needed to display each clipboard results page. Paging requires users to move to the next page to view more results.
- Make sure that, for an end user, the requestor size remains under an acceptable limit. Clipboard sizes that are greater than 5MB warrant investigation to ensure that all data retrieved is needed.
- Make sure that obsolete and dead data pages are removed, memory gets cleared regularly, and check memory leaks.
- Assess heavy data pages in your requestors and threads and reduce their footprint if possible.
- Monitor and adjust the number of requestors in the batch requestor pool.
Use the Performance Details to see the size of the clipboard and monitor memory usage through time.
Note: To alter the number of requestors in the pool, use the agent/threadpoolsize setting in the prconfig.xml file or DSS. Monitor the thread level pages as well to ensure and limit the amount of clipboard usage to required data only.
Archiving
In a production application, case data volume can grow to a size where hundreds of megabytes of database storage are required. You enable case archiving to move inactive cases to secondary storage. To archive cases, Pega Platform uses different jobs that you set up through Job Schedulers to copy, index, and purge specific artifacts in stand-alone cases and case hierarchies. You can archive the following artifacts to improve database performance:
- Child cases
- Declarative indexes
- Work history
- Pulse replies
- Attachments
Note: To learn more about improving database performance, see Improving database performance. For additional details on the archiving process, see Archiving and expunging case data.
Trimming and purging
If you are using a Pega Cloud environment, you can trim or purge tables using a SQL query tool or activities. Purging always occurs after archiving. First, establish a destination archive system that is a copy (uses the same rules and data schemas) of the source production system that you are archiving. Purging after archiving removes the rows from the tables.
Alternatively, Pega Platform provides a Purge/Archive wizard, which requires you first configure an activity to define the purge or archive criteria. Then, you schedule the purging or archiving activities. The Purge/Archive wizard is no longer officially supported. Instead, it is a best practice to use your organization's database tools to archive and purge data for your on-premise instances.
Caution: There is no easy way to recover deleted records, so purge with care. To learn more about the process and risks of purging, see Trimming and purging tables.
Check your knowledge with the following interaction:
If you are having problems with your training, please review the Pega Academy Support FAQs.
Want to help us improve this content?