Pega application monitoring
Many organizations use application performance monitoring (APM) tools to track and report on application performance and responsiveness. While these tools can report on data such as memory and CPU usage on your database and application servers, they do not provide detailed information about the health of the Pega Platform™ application itself.
Pega Platform contains tools to monitor and provide recommendations on how to address alerts that your Pega Platform application generates. These tools complement any APM tools you might use to give you a complete picture of the health of your application.
Pega Diagnostic Center
Pega Diagnostic Center(PDC) is a Pega-hosted software as a service (SaaS) application that monitors Pega Cloud® Services applications. You can also configure PDC to monitor on-premises applications.
PDC monitors every component of your system, collects, and aggregates monitoring data, and displays the data on several landing pages. These features help you navigate through and understand the presented information to improve the performance and design of your applications.
For clients on Pega Cloud, your Pega Platform package includes the PDC instance along with your exclusive virtual user account, known as a tenant.
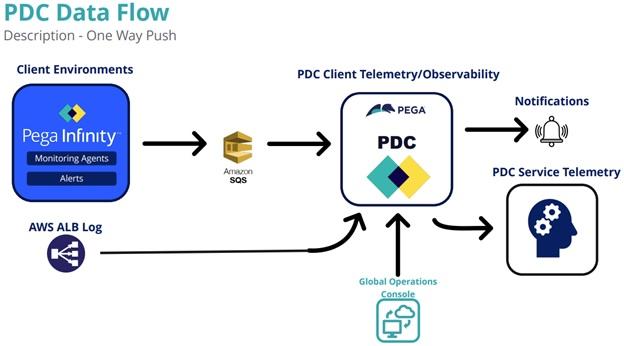
Each Pega Platform instance contains PDC monitoring agents (part of the PegaAESRemote ruleset) that collect diagnostic data. Your system sends alerts and diagnostic data through Amazon Simple Queue Service (SQS) asynchronously, which prevents the slowing of your systems. After receiving the data, PDC identifies issues in your system and can send you notifications about events critical to your business. The following diagram shows how the push of data from Pega Infinity™ to PDC occurs through Amazon SQS:
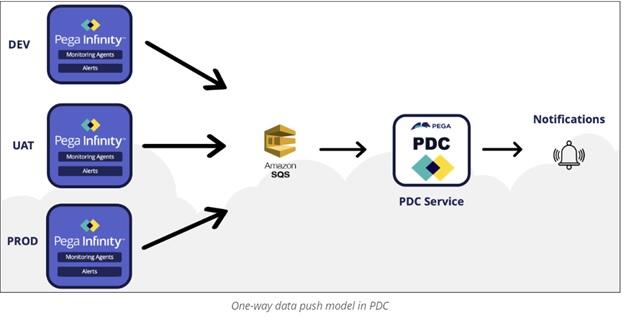
PDC is a multitenant system that receives data from multiple different Pega Platforms environments (development, user acceptance testing, and production), and generates required analytics as a notification, as shown in the following figure:
Data collected by PDC
PDC collects two categories of data:
- System metrics, including memory or CPU usage, the health of a component (for example, queue processors or listeners), and backing service information such as a search service.
- System events, which are predefined Pega alerts that occur in specific conditions, unhandled exceptions inside your application that Pega Platform did no identify, and alerts raised by Pega Platform components (for example, HTML generation, SQL execution, internal database, backing services).
PDC does not store, process, or accept personally identifiable information (PII) or other sensitive data, except for user names. If user names are sensitive (for example, if you use email addresses as user names), PDC can provide additional encryption by using operator ID encryption. PDC collects only diagnostic data and metadata on how the application performs. All data traffic is one-directional. PDC consumes the data which is published by your application.
Data security in PDC
PDC maintains data security through the following methods:
- Data is pushed from Pega Platform to PDC, but PDC does not access any systems.
- Data is transmitted over HTTPS, which is encrypted.
- Pega Platform provides digital message signing, which adds additional security to every message. The signature is unique for each system that PDC monitors and ensures the origin of every message that PDC receives.
- PDC does not collect any PII except for operator IDs. Enable the operator privacy mode to prevent PDC from storing this ID data.
- PDC replaces all bind variables with question marks in SQL-related alerts and errors.
- All parameter pages in alerts can be suppressed.
Who can use PDC?
Developers and performance experts can identify issues through performance insights and cases based on exceptions, which give information about factors that affect the system, such as:
- Stability. PDC ensures that there is no overconsumption of system resources. If it identifies any bottlenecks, PDC recommends a course of action to overcome these bottlenecks.
- Reliability. PDC provides insight into various system metrics such as network time, CPU time, memory consumption, and HTTP latency, which helps developers check whether the system meets the required service-level objectives of customers and system integrators.
- Availability. PDC provides insight into how long the system is up and running. It records when a downtime event occurs. If the downtime occurs because of a system failure in the scope of Pega Platform, PDC captures details about the root cause and presents a remediation action.
IT support engineers and operations engineers can detect issues early by setting automatic notifications in PDC for events that are critical to your business. For example, whenever an email listener fails to start, notifications are sent to support engineers to act on the event.
Application owners and product owners can measure the business value that your application delivers and prioritize investments into key areas. PDC can help them understand how customers use the application by providing information about the levels of traffic in the application and identifying which functionalities customers use the most. This information can help them to decide in which aspects of the application to invest to bring the most possible business value.
For more information about configuring PDC, see Configuring on-premises systems for monitoring with PDC.
For more information about integrations with PDC, see Integrations with project management tools in Pega Diagnostic Center.
Experienced system administrators can use Admin Studio, a role-based authoring and management environment focused on system operations such as agents, queues, and APIs.
The tool that you use depends on your monitoring requirements and if you want to customize the monitoring application.
For more information read documentation on PDC
Check your knowledge with the following interaction:
System health monitoring
Monitoring the health of the system is as important as the performance of an application. Pega Platform provides many options to assess the system's health on different parameters. Lead system architects (LSAs) can use several the Pega tools to monitor the health of the system.
Performance data
Pega Platform continuously generates data about the performance without impacting system performance. You can obtain performance data by using the Performance Analyzer (PAL). PAL provides information such as rule/server/RDB elapsed time, CPU statistics, and other input/output (I/O) operations. Analysis of the data helps you to understand the cause of delay in navigation from one view to another. You can use the Performance Profiler to retrieve performance information about the execution of activities, When rules, and data transforms.
Pega Platform continually generates performance data (PAL) , using PAL will help to understand how to read and analyze PAL.
Pega Platform issues alert if the application exceeds the thresholds that you have defined, they are categorized as Performance alerts, Security alerts, Database alerts, Operations alerts, Robotic alerts, etc., Alerts overview will help to study in detail about these alerts.
Lightweight lists data
Lightweight lists require less CPU memory and less processing than standard page lists. As a best practice, use lightweight lists wherever possible. To see the list of rules that do not use a lightweight list, view the Rules not using lightweight lists landing page, which displays a tab for each type of rule. The rules that do not use the lightweight lists report can identify rules where the lightweight list is applicable. You can also control the list by using the dynamic system setting (for example, clipboard/lightWeightList/enableForCorePRPCRules and clipboard/lightWeightList/enableForCustomerRules). As an LSA, be aware of the limitations and usage of lightweight lists to improve the performance of the application.
System state data
System state data that contains information such as data and work index status, the queues, and their status, is displayed in a JSON format. You can download system state data from Admin Studio or access it by using the REST API. Comparing the state of the system over time helps to determine what changes in the system might have caused problems.
JVM data
The version of JDK and configuration of Heap Memory and its increment have an impact on the memory performance and overall system throughput. Virtual memory allocation is an important system design consideration. Follow JVM vendor recommendations, and allocate the required memory to avoid common problems such as the out-of-memory exception.
Services data
You can track Pega application services separately to learn the impact that those services have on the performance of a Pega Platform application. The PEGA0011 alert and the service-PAL log file help to identify issues related to services. Consider changing the parameters of lengthy services or parsing rules to improve the performance after analyzing the alert and service-PAL log files.
For more information about the health monitoring Pega tools, see Monitoring the health of your system.
Check your knowledge with the following interaction:
If you are having problems with your training, please review the Pega Academy Support FAQs.
Want to help us improve this content?