
Tracer settings management
Tracer settings
The Tracer logs and displays events that occur as you use Pega Platform™. Using the Tracer is resource-intensive and dramatically slows application performance. To reduce the impact of running the Tracer, open and configure the Tracer settings to capture only the required information. Pause logging until you are ready to run the application section that you want to troubleshoot.
The Tracer toolbar is located above the log display, in the upper-right corner. The toolbar consists of buttons that enable you to manage the events that it captures.
Tip: You can only have one Tracer per operator, per node.
In the following image, click the + icons to learn more about the Pause, Clear, and Save buttons on the Tracer toolbar:
Refine event logging
Before you begin capturing events, refine what you need to capture by indicating the types of events and break conditions to log by using the Settings, Breakpoints, Watch, and Remote Tracer buttons on the Tracer toolbar.
In the following image, click the + icons to learn more about the Settings, Breakpoints, Watch, and Remote Tracer buttons on the Tracer toolbar:
Settings configuration
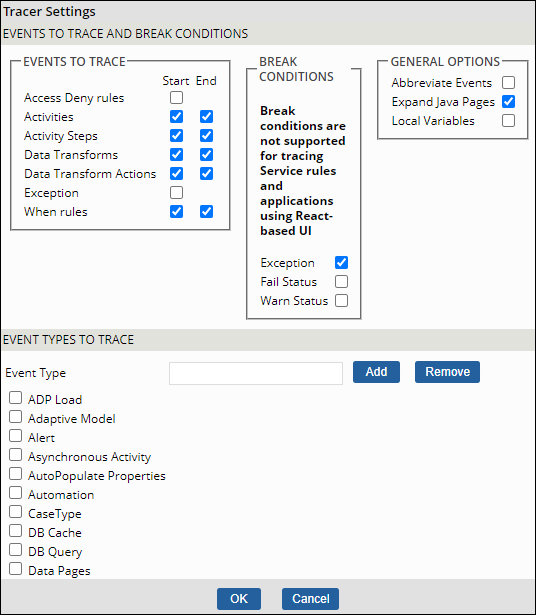
Use Settings to display the configuration options for your trace, to include event types and rules, and to enter the number of lines of data to display.
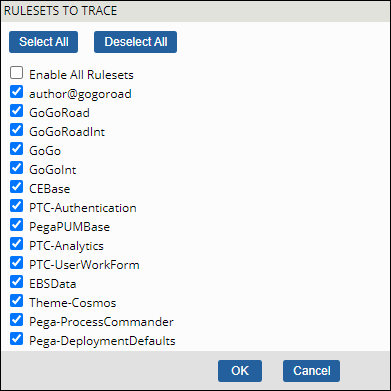
You can use the settings options to reduce the amount of information captured. You can filter tracer display results by event, event type, ruleset, and break conditions. For example, when you want to exclude local variables from your trace, or you want to view which activities run but not their steps. Selecting break conditions stops the tracer when the system generates an error.
The following two images provide a comparison of the number of events traced before and after activity steps are removed from the list of events to trace. In the image on the left, the trace includes steps for all of the activities performed during the trace. The steps for the Finish Assignment activity are located on rows 25 through 32.
The image on the right shows the trace results for the same activity when activity steps are removed from the events to trace. The Finish Assignment activity receives one line for the activity itself. It is located on row 7.
In the center of the following image, slide the vertical line to compare the Tracer logs.
Selection options
The following two images show selection options for , , , and
Tip: Scroll through the section to view and select the remaining options.
You can configure the maximum number of events to display with the Max Trace Events to Display field. The maximum number of events displayed on the screen is important when a tracer file has more than 5,000 lines. If a traced event returns 5,001 lines of data for the current settings, the display truncates row 1. Enter a 0 (zero) in the Max Trace Events to Display field to download the events without displaying the events on the screen.
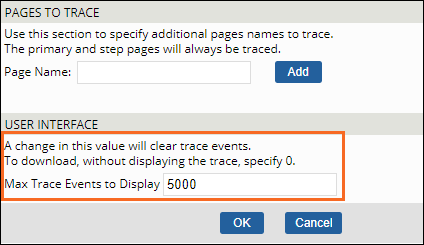
Note: Any increases to the number of events to display also increases your memory footprint and can impact system performance.
Breakpoints and Watch functions
You can configure a Breakpoint or a series of breakpoints to focus on an activity or series of activities that you want to trace. When the activity starts, the Tracer window highlights the event and tracing is paused. Tracing resumes when you click Play or when an hour elapses, whichever occurs first, providing you the ability to monitor the progress of the configured activity.

Note: When a breakpoint stops the Tracer, the processing on your thread also stops. Use Play to continue processing.
In the following example, a breakpoint is configured for the SendSimpleEmail activity in the Work class. The beginning of the step event is highlighted in the display.
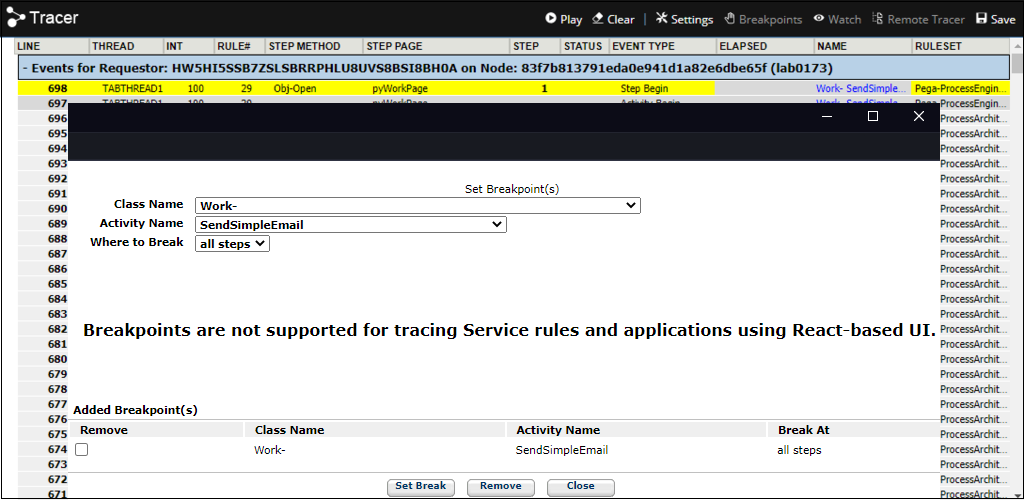
Caution: Breakpoints are not supported for tracing Service rules and applications using React-based UI
The Watch function is similar to breakpoints, but the watch monitors a specific property value or values to determine if and when the property value changes. This option is useful to check for property values, calculation consistency, and patterns in the trace.

Caution: Watch is not supported for tracing Service rules and applications using React-based UI
Note: The Tracer highlights the property change in yellow and shows a Property Inspector tool that indicates how the values changed.
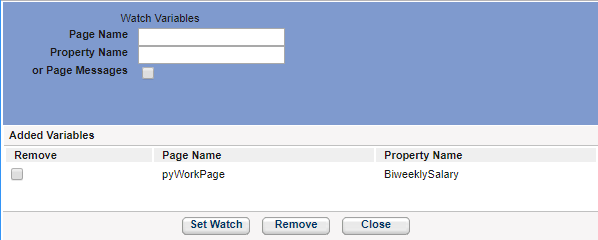
In the following image, a watch is configured for the property .BiweeklySalary on the pyWorkPage. You can add other variables to watch or remove selected variables. Close saves the configured variables.
The following image shows the Property Inspector. It indicates that the property value changed from zero to 2083.33.
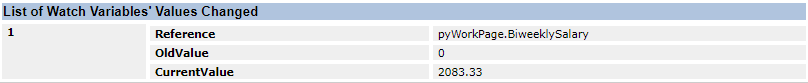
The OldValue and CurrentValue fields in the Property Inspector update whenever the property changes value.
Check your knowledge with the following interaction:
If you are having problems with your training, please review the Pega Academy Support FAQs.
Want to help us improve this content?