Viewing events and exceptions
Event Viewer
The Pega Diagnostic Center (PDC) Event Viewer displays information and exceptions in the Pega Alert log that occur in your Pega Platform™ deployment. Event Viewer provides quick, direct access to all events sent to PDC over the last 1 to 14 days.
You can use this information to do the following:
- Review events and associated metadata, execution context, and so forth.
- Sort and examine data by type, origin, and other characteristics to find patterns and correlations.
- Navigate from events to cases to investigate further specific issues.
The complete list of events is described in the List of events and notifications topic on the Pega Documentation site.
Event Viewer is a problem-solving tool for investigating issues in which you can access diagnostic data from all the nodes in your system. Event Viewer provides a live feed of log data for events that occurred in every node of your system in near real time and displays all events that PDC recognizes.
When specific conditions occur, or when your application encounters an exception, Pega Platform generates alerts and registers them in the Pega Alert log. The Pega Alert log contains raw alert data that you can view in Dev Studio. PDC creates system events based on these records.
You use Event Viewer to inspect events coming to PDC. With extensive grouping and filtering options, you can navigate across data streams to pinpoint the cause of the underlying issue that you are investigating.
Interpretation of the data that Event Viewer presents requires a certain level of knowledge. Therefore, you can use it to investigate specific issues.
Choosing a time interval for Event Viewer
To see general distribution of events over time, or to narrow your search for a specific issue, choose a time interval for which you want to see the events, as shown in the following example. The time interval can range from 1 to 14 days.
Filtering in Event Viewer
To locate a specific exception or alert, filter the list with the global Filter button at the top of Event Viewer, or use the quick filters (the horizontal lines) to the right of each event record.
You can filter all events by the following criteria:
- Type – Select the type of event to see: exception, alert, or Java Virtual Machine (JVM) garbage collection (GC). A special icon in the Type column informs you about urgent events that require your immediate attention.
- Event – Select the event title or exception message.
- Case ID – Select a specific case to see all related events.
- Application – Select the application to view.
- Operator – Select the user account to see problems that a specific user was experiencing.
- Requestor – Select the session to search for events.
- Int ID – Select the interaction ID to view.
- Node – Select the system from which the events came.
- Maintenance mode – View only events that occurred when maintenance mode was on.
- Requestor type – Select one or more of the following requestor types: Web, Service, Background, and Async.
- PAL characteristics – Select a PAL characteristic to filter PEGA0001 and PEGA0011 events during a specified time interval. For example, you can filter for events with a DP load time that exceeds 30% or 75% of the total time.
- Category – Select one or more event categories, for example, Connectors, Database, Decisioning, and so on.
- User session (stateless app) – Select all events that your application generates within a single session. You can apply this filter only to stateless applications that are based on the Cosmos React UI.
PDC displays each active filter above the events table.
In the center of the following image, slide the vertical line to compare Event Viewer results before and after filtering:
Grouping in Event Viewer
To compare the number of events with different criteria in mind, group the records in Event Viewer by the following parameters:
- Case ID – Group events related to a single case. This grouping helps you find the cases that affect your system's performance the most.
- Event Type – Group events of the same type. This grouping helps you find the type of event that occurs most frequently.
- Application – Group events related to the same application. This grouping helps you find the application that generates most events.
- Operator – Group events that were triggered by a single user's actions. This grouping can help you find the users that cause the most performance problems with your system.
- Node – Group events that occurred on the same node. By using this grouping, you can find the slowest nodes in your system.
- Requestor – Group events that share the same requestor. This grouping helps you analyze which requestors generated the most events.
- PAL characteristics – Group events by PAL characteristics that occurred during a specified time interval. For example, you can group events that have a CPU time of more than 30% or 75% of the total time.
- User session – Group events that your application generates within a single user session. This grouping applies only to stateless applications that are based on the Cosmos React UI. By using this grouping, you can diagnose performance issues, security issues, and errors that apply to a single user session
The result is the number of events for the chosen parameter that occurred in the specified time window, which helps you to notice a potential spike in the events for a specific entry.
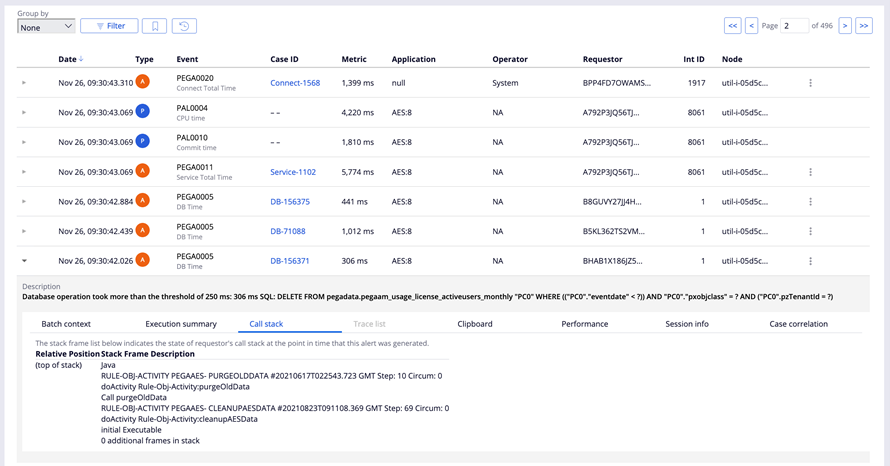
In the center of the following image, slide the vertical line to see how grouping by event type can show a high number of PEGA0005 events:
Bookmarking in Event Viewer
If you use PDC to regularly inspect the same issue, you can bookmark your search to save time.
PDC users share bookmarks. Bookmarking helps you to easily return to your preset filtering configuration and to avoid manually filtering the table each time that you need to investigate something.
The Recent activities button displays your activities in the current session.
In the following image, click the + icons to learn more about the bookmarking options in Event Viewer:
Check your knowledge with the following interaction.
Understanding common events in Event Viewer
The following common events are often seen in Event Viewer:
- PEGA0001: HTTP interaction time exceeds limit – A slow web interaction initiated from a browser.
- PEGA0011: Total request time exceeds limit – A slow call to a service exposed by an application.
- PEGA0005: Query time exceeds limit - Slow execution of an SQL query to the PegaRULES database.
- PEGA0020: Total connect interaction time exceeds limit – A slow connector call from application code.
The majority of events are PEGA alerts that are described in the List of events and notifications in PDC topic on the Pega Documentation site.
Investigating issues for specific users
In Event Viewer, you can combine grouping and filtering options to investigate issues that are reported by specific users.
To check the session of a specific user to find an issue that they encountered, do the following:
- Sort by Operator (user).
- Click the number of events connected with that user.
- Filter by requestor.
- Click the number of events connected to that requestor.
The result is a view of a single session of the selected user. You can create a bookmark to save this information.
To investigate application issues that are reported by several users, do the following:
- Filter by Operator to see what events the user actions generated.
- Look for similarities between their sessions.
For example, a single node could cause most events. By inspecting this node, you might be able to pinpoint and remediate the cause of the issues, for example, not enough memory.
Check your knowledge with the following interaction.
This Topic is available in the following Module:
Want to help us improve this content?