Analyzing results of a simulation using reports
2 Tasks
10 mins
Beginner
English
Scenario
U+ Bank is currently cross-selling on the web by showing various credit cards to its customers.
The bank wants to run a distribution test simulation in Pega Customer Decision Hub™ and output the results to a database table and view the results by using out-of-the-box simulation reports.
Use the following credentials to log in to the exercise system:
| Role | User name | Password |
|---|---|---|
| Next-Best-Action Designer | NBADesigner | rules |
Your assignment consists of the following tasks:
Task 1: Create and run a distribution test simulation
Create a distribution test simulation run to:
- Use the Trigger_NBA_Grow_Creditcards strategy.
- Output the run results to the database.
- Add out-of-the-box simulation reports to the simulation.
Task 2: View the simulation run results
Use the out-of-the-box simulation reports to view the simulation run results.
Challenge Walkthrough
Detailed Tasks
1 Create and run a distribution test simulation
- On the exercise system landing page, click Pega Infinity™ to log in to Customer Decision Hub.
- Log in to Customer Decision Hub as a Next-Best-Action Designer:
- In the User name field, enter NBADesigner.
- In the Password field, enter rules.
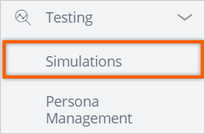
- In the navigation pane of Customer Decision Hub portal, click Testing > Simulations.
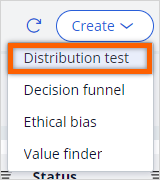
- In the upper-right corner, click Create, and then select Distribution test to configure the settings for the strategy configuration.
- In the Configure inputs section, in the Strategy tile, click Configure to select a strategy on which you want to run the simulation.
- In the Strategy dialog box, in the Trigger_NBA_Grow_Creditcards strategy, click Add to select the strategy.
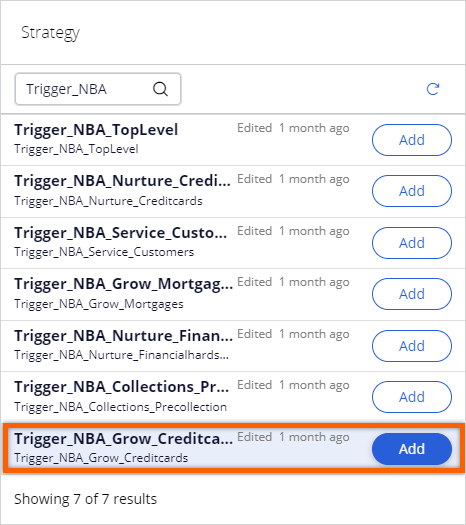
- Click Apply to add the strategy.
- In the Configure inputs section, in the Audience tile, click Configure to select an audience on which you want to run the simulation.
- In the Audience dialog box, in the SampledCustomers_Inbound audience, click Add to select audience.
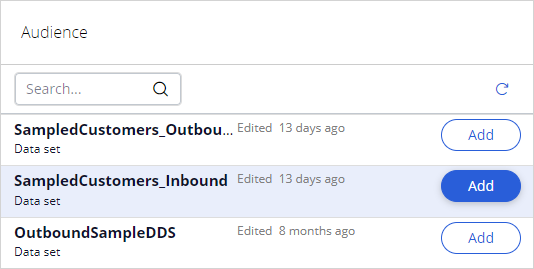
- Click Apply to add the audience.
- In the Simulation name field, enter DistributionTest.
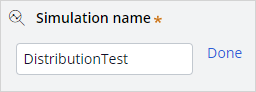
- Click Done.
- In the Assign output destinations section, click Create new to add a new output destination.
- In the Create new output dialog box, configure the following information.
- In the Name field, enter SimulationResults.
- In the Type list, select Database Table.
- Click Done to complete the output destination details.
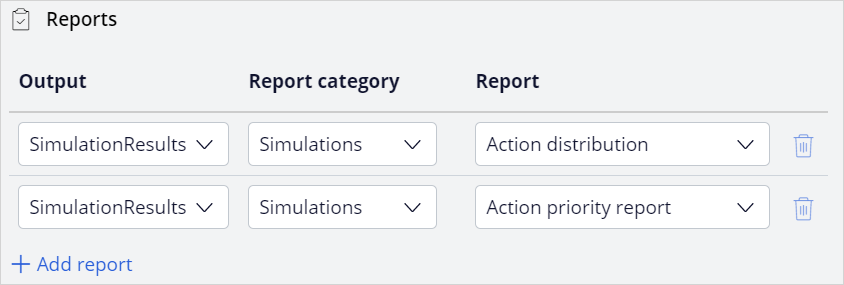
- In the Assign reports to outputs section, click Add report new to add a new output destination.
- In the Assign reports to outputs dialog box, add the following report:
- In the Output list, select SimulationResults.
- In the Report category list, select Simulations.
- In the Report list, select Action distribution.
- In the Assign reports to outputs section, click Add report new to add a new output destination.
- In the Assign reports to outputs dialog box, add the following report:
- In the Output list, select SimulationResults.
- In the Report category list, select Simulations.
- In the Report list, select Action priority report .
- Click Submit and run to run the simulation.
2 View the simulation run results
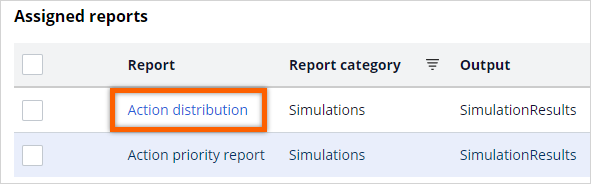
- Once the simulation run is complete, click Review reports.
- Open the Action distribution report.
- View the volume of individual actions.
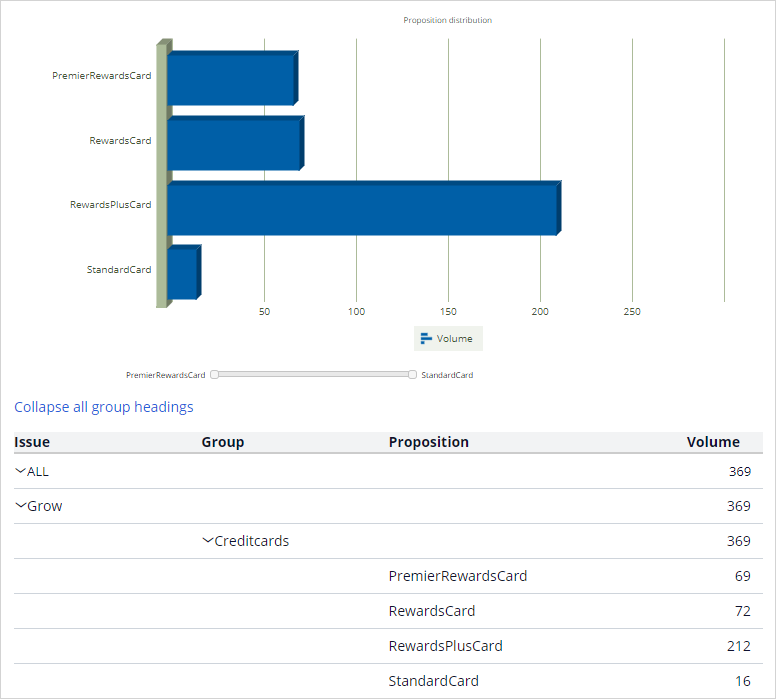 Note: The Monte Carlo data set generates a mock data set. Different simulation runs have different results.
- Close the report.
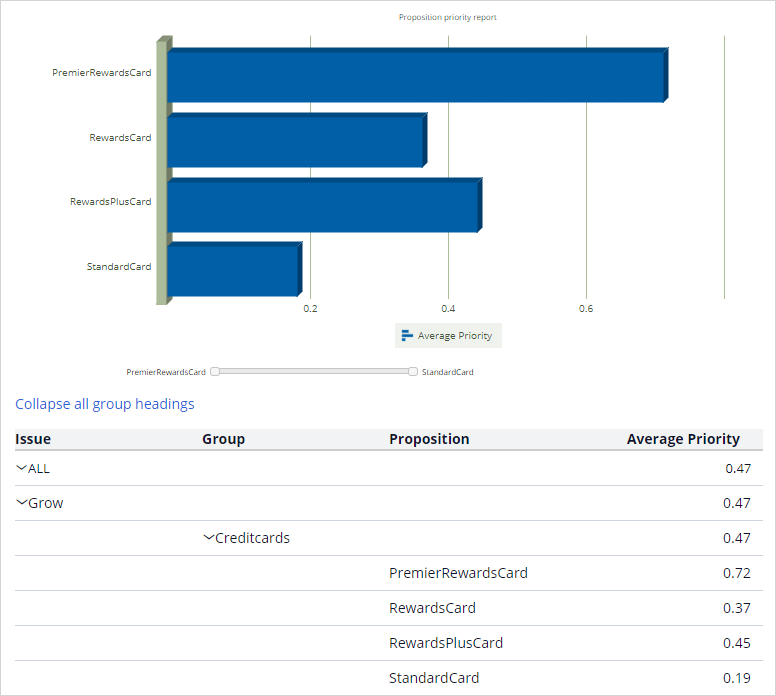
- Open the Action priority report.
- View the average priority of individual actions.
 Note: The Monte Carlo data set generates a mock data set. Different simulation runs have different results.
This Challenge is to practice what you learned in the following Module:
Available in the following mission:
If you are having problems with your training, please review the Pega Academy Support FAQs.
Want to help us improve this content?