Analyzing results of a simulation using reports
3 Tasks
10 mins
Beginner
English
Scenario
U+ Bank is currently cross-selling on the web by showing various credit cards to its customers.
The bank wants to run a distribution test simulation in Pega Customer Decision Hub™ and output the results to a database table and view the results by using out-of-the-box simulation reports.
Use the following credentials to log in to the exercise system:
| Role | User name | Password |
|---|---|---|
| Next-Best-Action Designer | NBADesigner | rules |
Your assignment consists of the following tasks:
Task 1: Prepare data set for simulation run
Run the PrepareSimulationData data flow to prepare the data set for the simulation run.
Note: The SampledCustomers_Inbound is not available in a persisted store. To initialize the customer data, first, run the PrepareSimulationData data flow.
If you already ran the PrepareSimulationData in this exercise system as part of a previous challenge, you do not need perform this task.
If you already ran the PrepareSimulationData in this exercise system as part of a previous challenge, you do not need perform this task.
Task 2: Create and run a distribution test simulation
Create a distribution test simulation run to:
- Use the Trigger_NBA_Grow_Creditcards strategy.
- Output the run results to the database.
- Add out-of-the-box simulation reports to the simulation.
Task 3: View the simulation run results
Use the out-of-the-box simulation reports to view the simulation run results.
Challenge Walkthrough
Detailed Tasks
1 Prepare data set for simulation run
- On the exercise system landing page, click Pega CRM suite to log in to Customer Decision Hub.
- Log in as Next-Best-Action Designer with User name NBADesigner and Password rules.
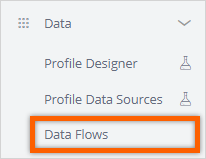
- In the navigation pane of Customer Decision Hub, click Data > Data Flows to view the list of data flows.
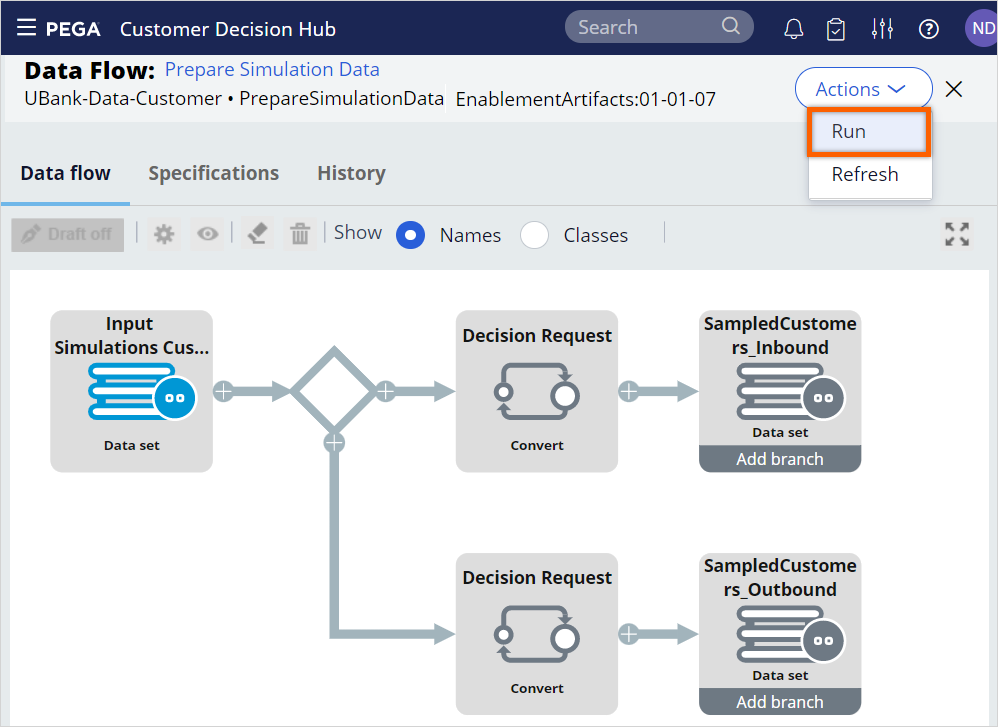
- In the list of data flows, search for and then open the PrepareSimulationData data flow to prepare the data set used for simulations.
This data is based on a Monte Carlo dataset, which is generated by the system.Note: The Monte Carlo data set generates a mock data set. As a result, different simulation runs have different results.
- Click Actions > Run to open the data flow work item.
- Click Submit.
- Click Start to process the data, and then wait for the processing to complete.
Note: Notice that the prospect data is populated once the test run is complete.
- Close the data flow window.
2 Create and run a distribution test simulation
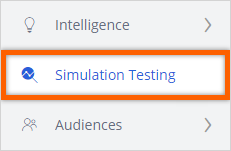
- In the navigation pane of Customer Decision Hub portal, click Simulation Testing.
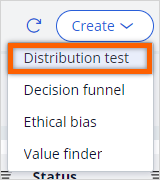
- In the upper-right corner, click Create,and then select Distribution test to configure the settings for the strategy configuration.
- In the Configure inputs section, in the Strategy tile, click Configure to select a strategy on which you want to run the simulation.
- In the Strategy dialog box, in the Trigger_NBA_Grow_Creditcards strategy, click Add to select the strategy.
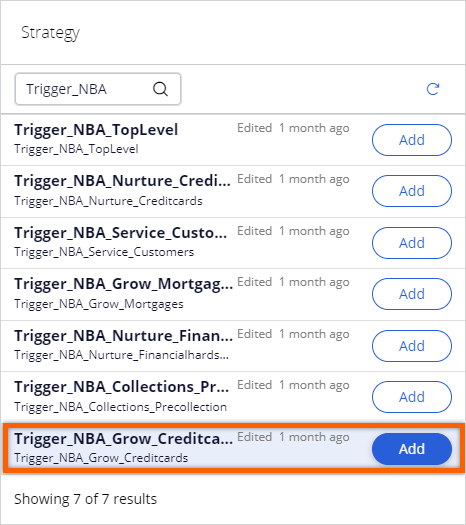
- Click Apply to add the strategy.
- In the Configure inputs section, in the Audience tile, click Configure to select an audience on which you want to run the simulation.
- In the Audience dialog box, in the SampledCustomers_Inbound audience, click Add to select audience.
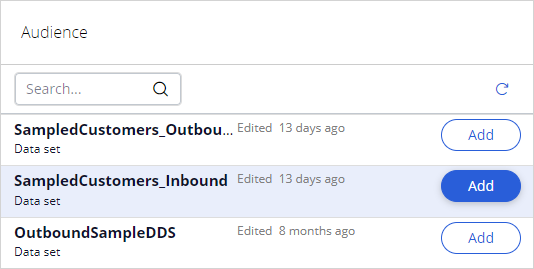
- Click Apply to add the audience.
- In the Simulation name field, enter DistributionTest.
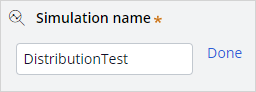
- Click Done.
- In the Assign output destinations section, click Create new to add a new output destination.
- In the Create new output dialog box, configure the following information.
- In the Name field, enter SimulationResults.
- In the Type list, select Database Table.
- Click Done to complete the output destination details.
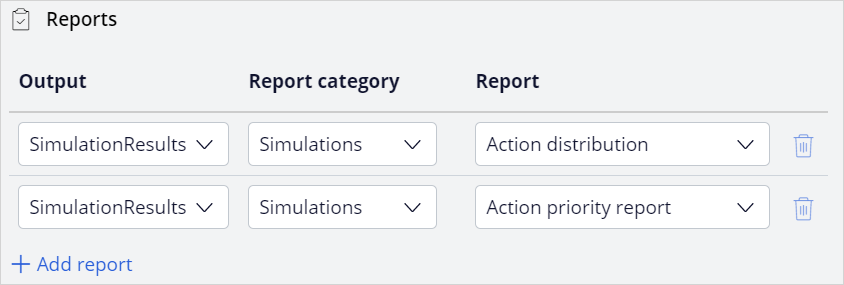
- In the Assign reports to outputs section, click Add report new to add a new output destination.
- In the Assign reports to outputs dialog box, add the following report:
- In the Output list, select SimulationResults.
- In the Report category list, select Simulations.
- In the Report list, select Action distribution.
- In the Assign reports to outputs section, click Add report new to add a new output destination.
- In the Assign reports to outputs dialog box, add the following report:
- In the Output list, select SimulationResults.
- In the Report category list, select Simulations.
- In the Report list, select Action priority report .
- Click Submit and run to run the simulation.
3 View the simulation run results
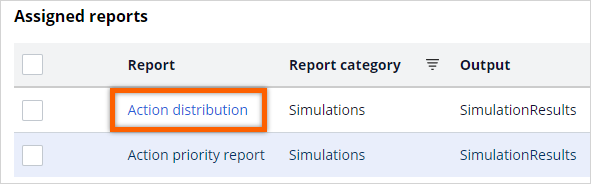
- Once the simulation run is complete, click Review reports.
- Open the Action distribution report.
- View the volume of individual actions.
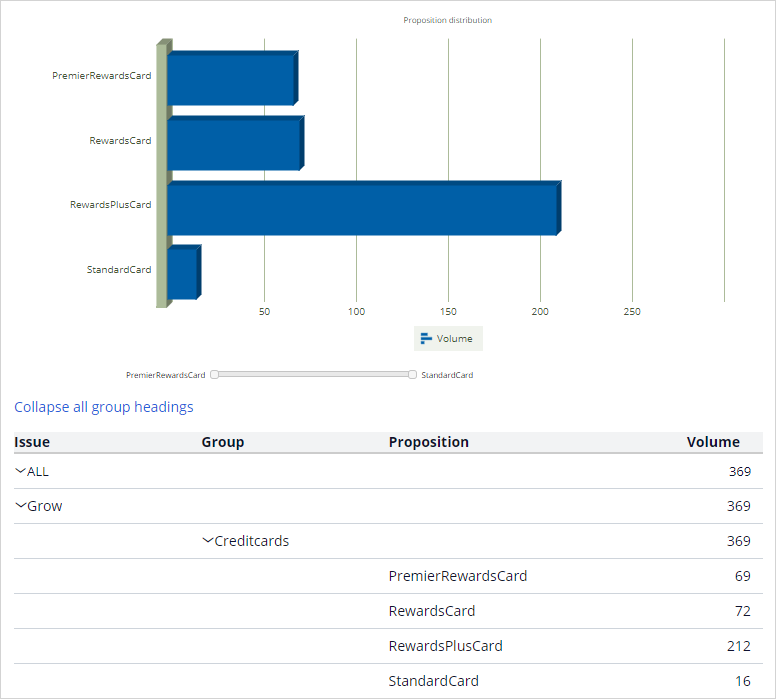 Note: The Monte Carlo data set generates a mock data set. Different simulation runs have different results.
- Close the report.
- Open the Action priority report.
- View the average priority of individual actions.
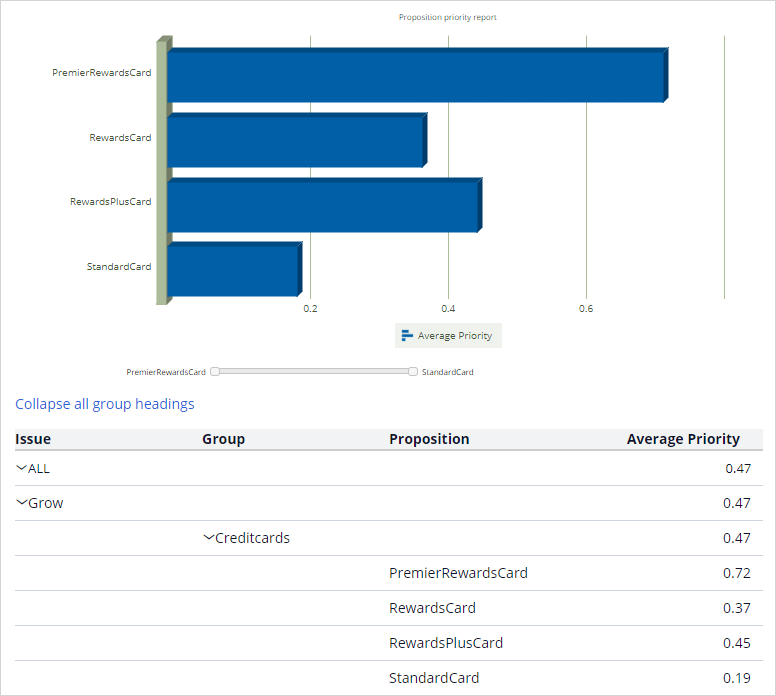 Note: The Monte Carlo data set generates a mock data set. Different simulation runs have different results.
If you are having problems with your training, please review the Pega Academy Support FAQs.
Want to help us improve this content?