Queries based on generated or reformatted data
Discover the benefits of reformatting the required data for a report to meet reporting requirements, instead of using the same report generated from standard tables in Pega Platform™.
Scenario
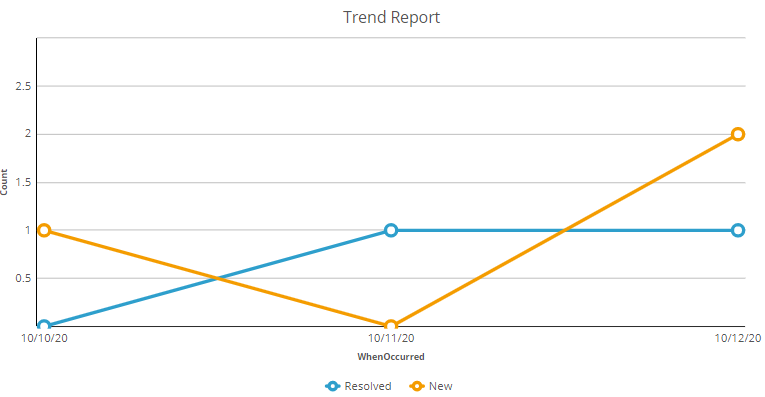
A reporting requirement calls for a trend report that displays the number of Cases created by the system and the number of cases resolved by users each day. The assumption is that Cases can take longer than a day to complete.
The following figure of a Trend Report chart displays the number of Cases created and resolved on a given day. To generate this report, you require two records, each with a WhenOccurred property and an EventType property. The EventType property should have two values: New and Resolved.
Solution designs
There are several possible design approaches:
- Work pool: You should not define a trend report against the work pool class of the analyzed Cases. A trend report requires a specific date to plot the two results, such as the number of Cases created and the number of Cases resolved. Using pxCreateDateTime or pyResolvedTimeStamp as the plotting date will result in inaccurate data. Cases that resolve long after creation, or Cases created well before resolution, distort daily counts. A single trend report built directly on the work pool class cannot accurately represent daily counts because:
- pxCreateDateTime and pyResolvedTimeStamp occur on different days.
- Trend reporting requires uniform events, not mixed timestamps.
- Cases resolved days or weeks after creation distort daily metrics.
Work pool-level reports are useful for aggregate Case metrics, but not suitable for multi-event trend visualizations.
- History table: Although you can identify Case‑creation and Case‑resolution events by querying descendant classes of History‑Work, this approach is complex. History tables store many types of audit events, not only creation or resolution. Filtering a high‑volume, append‑only table causes performance issues. History tables are not indexed for analytical reporting and are not intended for trend reporting.
The history table contains all audit events and not just creation or resolution.
History tables are append-only, high-volume, and not indexed for analytical use. They are not intended for reporting. -
Custom data table: Instead of searching for Case creation and resolution events in the Case history, use a separate Data Type called Data-SimpleCaseHistory. In this Case, EventType only accepts two values: Create and Resolve. You can create a trend report against this table or join the work pool class to this table using pyID = CaseID. Each EventType is plotted against the WhenOccurred DateTime value. You can also generate data instances in this table retroactively.
Property Purpose CaseID (String) Identifier to join to the work class (pyID). CaseType (String) Useful for filtering and reporting across multiple Case Types. EventType (String) Identifies the type of Case Life Cycle event recorded for this Case history entry (for example, Create or Resolve). WhenOccurred (DateTime) The timestamp used for trend reporting.
- Timeline data table: Another approach is to create and maintain a timeline table that contains a continuous series of dates used for plotting trend data. This table is prepopulated with dates extending as far into the past and future as reporting needs require. Because this table is generic, it can also be reused by multiple trend reports across the application.
A key limitation in Pega trend reporting is that you cannot perform a JOIN using SQL functions such as DAY(), or expressions such asDATE(pxCreateDateTime)orDATE(pyResolvedTimeStamp).
To support joining against a calendar table, you must:- Add exposed, date-only properties (for example, .CreateDate, .ResolveDate) to the work pool table.
- Populate these properties when the Case is created or resolved.
- Index these database columns to ensure the join performs efficiently.
The trend report that uses the timeline table requires two subreports:
- Creation subreport: Selects and counts Cases whose CreateDate matches the timeline date.
- Resolution subreport: Selects and counts Cases whose ResolveDate matches the same timeline date.
The system then combines these results in the main report to produce a continuous daily trend line, even for days when no Cases were created or resolved, because the timeline table ensures that every date has a row.
Columns include:- Data-Timeline
- Date Date
- TrueFalse IsWeekStart
- TrueFalse IsMonthStart
- TrueFalse IsYearStart
This design provides a flexible, reusable calendar dimension that supports consistent, gap-free reporting for Cases and other time-based metrics.
Conclusion
The timeline approach is equally effective as the SimpleCaseHistory method because it involves joining the work pool table twice. However, it has limited use as a list report because each subreport performs a COUNT operation rather than allowing the main report to use a GROUP BY aggregation, which is necessary for charting. While it is technically possible to use SQL to UNION the results of the two subreports, this is not supported by the Report Definition Rule in Pega Platform.
The ideal solution is to base the trend report on the SimpleCaseHistory class alone without joining to the work pool table, which demonstrates the benefit of extracting data and saving that data to a different format to facilitate business intelligence.
Check your knowledge with the following interaction:
このトピックは、下記のモジュールにも含まれています。
トレーニングを実施中に問題が発生した場合は、Pega Academy Support FAQsをご確認ください。