Application quality metrics
While developing a software application, you need to regularly monitor various quality metrics of the application to deliver high-quality applications to customers.
The quality metric comprises both functional (logic- and design-related) and non-functional (system- and infrastructure-related) metrics. There are no standard or prescribed metrics to measure the quality of a software application, and every product or company uses its own quality metric.
In Pega Platform™, you use the Application Quality dashboard to monitor key functional quality metrics for a single application or a stack of selected applications. You can access the Application Quality dashboard from the menu in the header of Dev Studio.
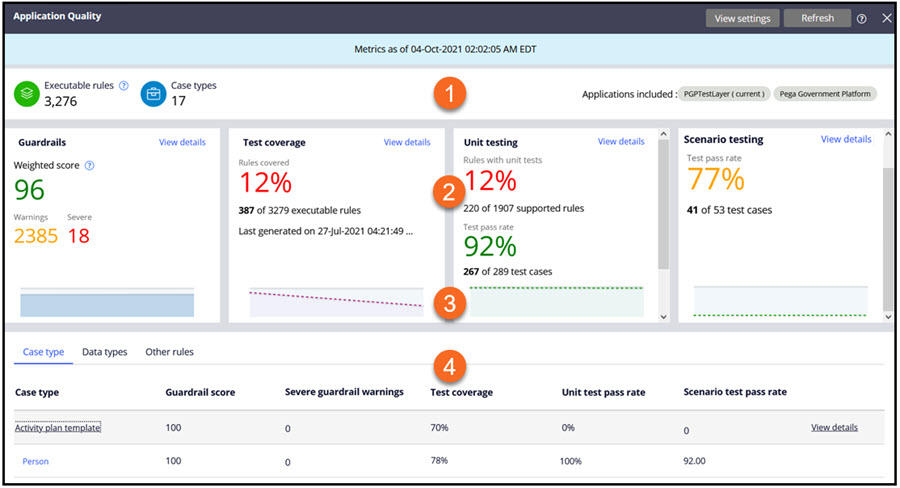
The Application Quality dashboard consists of multiple sections that provide various quality metrics, as shown in the following figure:
-
Application information
The application information displays key information related to the applications that you monitor for quality on this dashboard.
This area consists of the following details:
- Timestamp
- Executable rules
- Case types
- Applications included
Timestamp: Displays the timestamp of the generated metrics that are on the dashboard. The dashboard refreshes with the latest metrics when one of the following actions occurs:
- When a user logs into the application.
- When a user clicks Refresh in the header of the dashboard.
Executable rules: Displays the number of rules that the Test Coverage feature supports. This metric applies only to the test coverage metric that is displayed on the dashboard. Other metrics correspond to all the rules of the applications that are in the quality dashboard metrics.
Case types: Displays the number of case types that are present in the applications that are in the quality dashboard metrics.
Applications included: Displays the names of applications that are in the quality dashboard metrics. You can configure these applications in the Application Quality settings.
- Application-level metrics
The application-level metrics consist of four default metrics for the applications in the quality dashboard metrics.
Guardrails: This metric shows the weighted guardrail score of the applications, the total number of warnings, and the total number of severe warnings, as shown in the following figure:
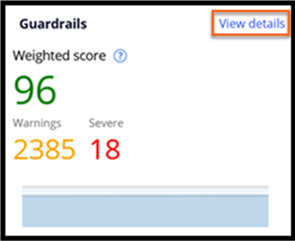
Clicking View details displays the Guardrail landing page and the detailed information about the guardrail warnings.
Test coverage: This metric shows the percentage and number of rules that are covered out of the total executable rules of the applications, as shown in the following figure:
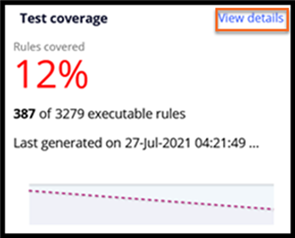
The test coverage data displayed on the dashboard is extracted from the latest application-level test coverage report that is generated for all applications. This metric displays the timestamp of the application-level test coverage report from which this data is extracted.
Clicking View details displays the test coverage landing page and the detailed information related to the covered and not covered rules.
Note: Refreshing the quality dashboard metrics does not automatically generate new test coverage data. You first generate a new application-level test coverage report, and then, on the quality dashboard, click to obtain new coverage data.Unit testing: This metric displays the number of rules that have Pega unit test cases and the latest execution results of these test cases for the applications.
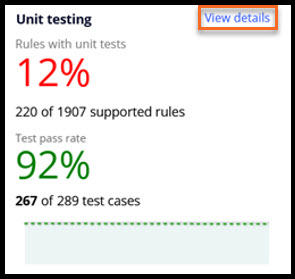
Clicking View details displays the Pega unit testing landing page and detailed information about the passed and failed test cases.
Note: Unit testing data is displayed for the rules that Pega unit testing supports, but the information is not displayed for all rules. Refreshing the quality dashboard metrics does not automatically execute the Pega unit test cases for updated results. You manually execute all Pega unit test cases and then click on the quality dashboard to retrieve the most current Pega unit testing data.Scenario testing: This metric shows the percentage and number of Pega scenario test cases that pass for the applications.
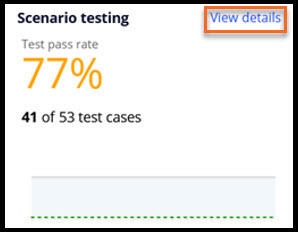
Clicking View details displays the Pega scenario testing landing page and the detailed information about the passed and failed test cases.
Note: Refreshing the quality dashboard metrics does not automatically execute the Pega scenario test cases for updated results. You manually execute all Pega scenario test cases and then click on the quality dashboard to retrieve the most current Pega scenario test case execution data. - Quality trends
This section displays the quality trend of a particular metric over a certain duration. The default duration for the trend is two weeks, but you can configure this duration by using the Application quality settings.
- Metrics for case types, data types, and all other rules
This section consists of the following tabs:
- Case type: This tab displays the quality metrics of all the rules that belong to the same class as the case type.
- Data type: This tab displays the quality metrics of all the rules that belong to the same class as the data type.
- Other rules: This tab displays the quality metrics of all the rules that do not belong to the case type or data type class.
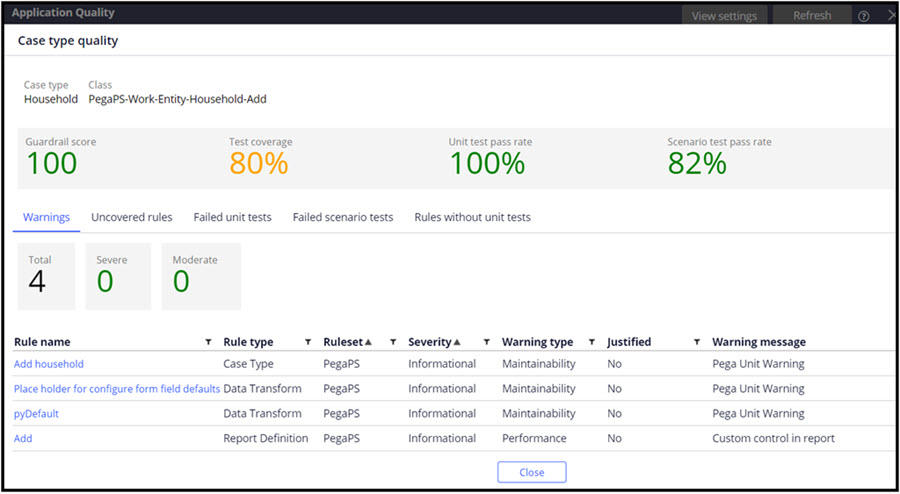
Clicking View details on any case type or data type record displays detailed metrics about the corresponding case type or data type, as shown in the following figure:
In the following figure, click the + icons to learn more about the various tabs on the Application Quality dashboard that display the detailed metrics related to different categories:
Check your knowledge with the following interactions:
Method to generate application quality metrics
You use the following process to generate application quality metrics:
- Start the application-level test coverage report.
- Run all the Pega unit test cases of the applications included, from the Pega unit testing landing page.
- Run all Pega scenario test cases of the applications included, from the Pega scenario testing landing page.
- Run all other types of tests.
- Stop the application-level test coverage report.
- Refresh the Application quality dashboard.
Color-coding ranges for the quality metrics in the Application Quality dashboard
Refer to the following table to understand the color coding for the quality metrics in the dashboard:
| Metric | Red - stop development and fix issues | Orange - continue development and fix issues | Green - continue development | |
|---|---|---|---|---|
| Guard rails | Weighted score | 0-59 | 60-89 | 90-100 |
| pyIsWeightedScoreSevere | pyIsWeightedScoreModerate | pyIsWeightedScorePermissible | ||
| Number of warnings | Not applicable | More than 0 | 0 | |
| pyIsWarningsModerate | pyIsWarningsPermissible | |||
| Number of severe warnings | More than 0 | Not applicable | 0 | |
| pyAppContainSevereWarning | pyAppContainNoSevereWarning | |||
| Test coverage | Rules covered | 0%-59% | 60%-89% | 90%-100% |
| pyIsRuleCoverageScoreSevere | pyIsRuleCoverageScoreModerate | pyIsRuleCoverageScorePermissible | ||
| Unit testing | Test pass rate | 0%-59% | 60%-89% | 90%-100% |
| IsTestPassRateScoreSevere | IsTestPassRateScoreModerate | IsTestPassRateScorePermissible |
Note: You can overwrite the ranges of the color codes by modifying the corresponding When rules listed in the table in the Data-Application-Quality class.
This Topic is available in the following Module:
If you are having problems with your training, please review the Pega Academy Support FAQs.
Want to help us improve this content?