
Building models with Pega machine learning
Introduction
Prediction Studio offers several options for leveraging customer data to create predictive models. Learn how to develop powerful and reliable models that can predict customer behavior, such as offer acceptance, churn rate, credit risk, or other types of behavior by using Pega machine learning.
Video
Transcript
This demo will show you how to build a predictive model using Pega machine learning in Prediction Studio.
In an effort to proactively prevent churn, U+ Bank wants to predict the likelihood that a customer will leave the bank in the near future. When starting to build a new model, you will be presented with the option to create a model on a template that is used for streamlining model development. One of these is churn modeling.
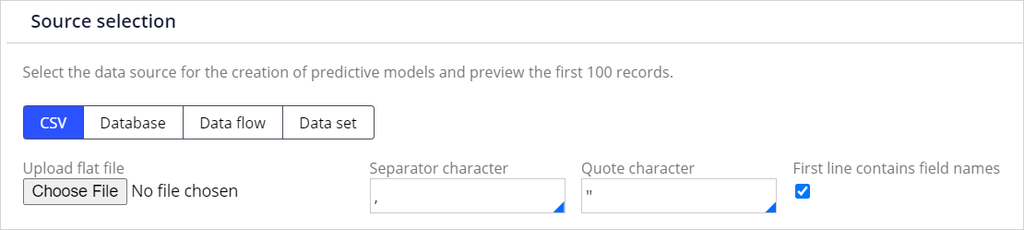
The model build itself consists of 5 steps: Data preparation, data analysis, model development, model analysis, and model selection. In the data preparation step, the data source containing the historical data is selected, the sample is constructed, and the outcome of the model is defined. The data source can be a csv-file, a database table, a data flow, or a data set.
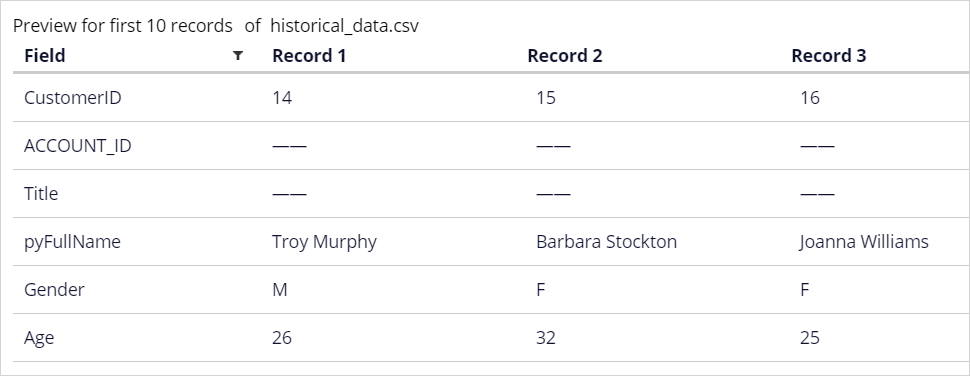
The preview of the first ten records in the data set allows you to verify that all fields will be correctly imported.
Next, construct the sample. Using a weight field is optional; it is only used when the data source contains such a field. If you do not specify the field, each case counts as one. The type of field to be sampled can be set to either numeric or categorical.
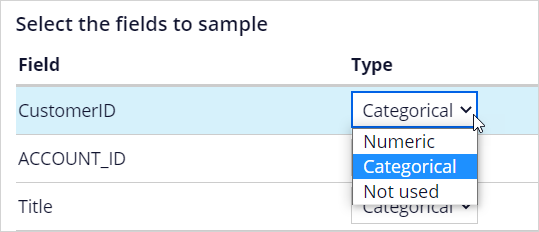
By default, all fields are considered potential predictors. When setting predictors, it's important to use some common sense. For example, the customer ID is a random number and has no impact on the behavior to be predicted.
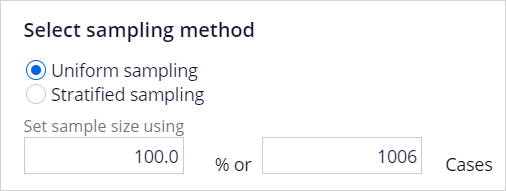
Likewise, the name of the customer has no predictive value. For such fields, change the type to 'Not used'. If the data contains a relatively small number of cases, you will want to use 100% of the records. If the data source is large, a sample will be sufficient.
Next, you define the hold-out sets for validation and testing during model development. Your models will be trained with the remainder of the data. Once trained, the validation set is used to check for robustness of candidate models and to compare their performance.
Finally, the test set is used to analyze the performance characteristics of candidate models, and to select the best model.

Finalize the data preparation step by defining the outcome to be predicted. You can predict a binary outcome, as in this example, or predict a continuous outcome. For a binary outcome type, the outcome field must be categorical. For a continuous outcome type, the outcome field must be numerical. Here you also map the values of the outcome field to the outcome category. With that, you specify how to differentiate between good and bad behavior.

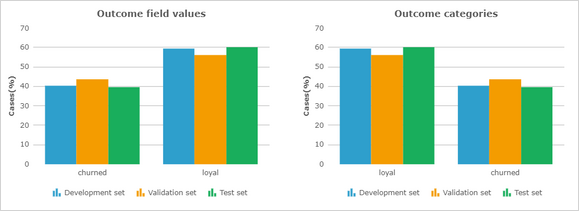
It is worthwhile to verify that the customer distribution across the development data set is similar to the whole sample.
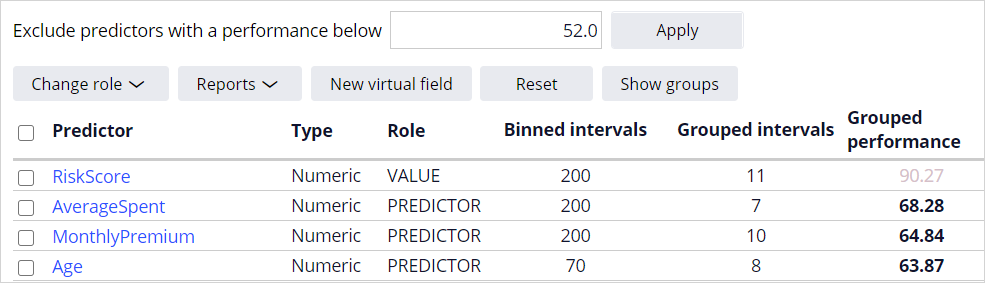
In the data analysis step, you analyze the individual predictors. By default, only predictors with a performance higher than 52 are included. For fields that have a very high performance, the Role is set to value to protect models from accidentally using predictors that might be directly correlated to the outcome.
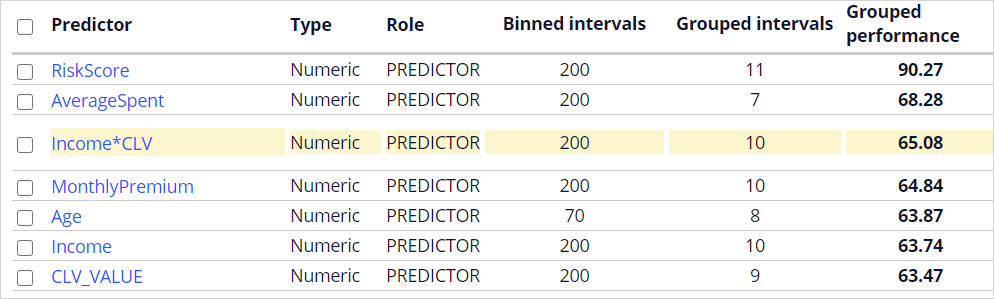
You can also manipulate features to create a better predictor by creating a 'New virtual field'. This is a fundamental step towards having good models. Income*CLV is such a virtual field. The performance of this new predictor is higher than that of the individual fields.
Data analysis creates a binned, ordinal view of individual predictors. Both Binning and Granularity are automatically set but can be manually adjusted.

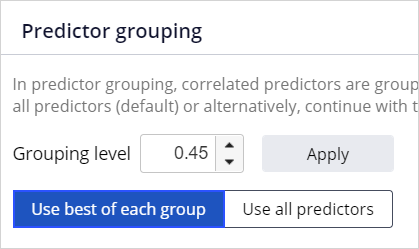
As part of model development, the grouping and predictor selection process is automated. When multiple predictors are correlated, considering them all for the machine learning process will lead to unnecessary model complexity. It is best practice to select the best-performing predictor in each group.
Prediction Studio provides a rich model factory that supports industry-standard models. You can create 4 types of models: Regression models, Decision tree models, Bivariate models, and Genetic algorithm models. By default, a Regression and a Decision tree model are automatically created. These models are highly transparent. Bivariate models and Genetic algorithm models have a lower transparency score.

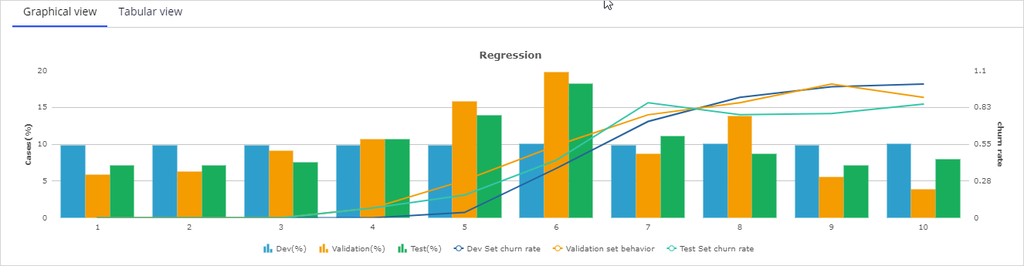
The purpose of the next step, Model Analysis, is to select the best model for your use case. In the 'Score comparison' step, you can compare the scores generated by the models in terms of behavior, lift, gains, and discrimination. Prediction Studio uses Area Under the Curve (or AUC) to measure the performance of predictors and models. You can describe AUC as the measure of how well the model is able to discriminate between good and bad cases. The value of AUC ranges from 50%: random distribution, to 100%: perfect discrimination.

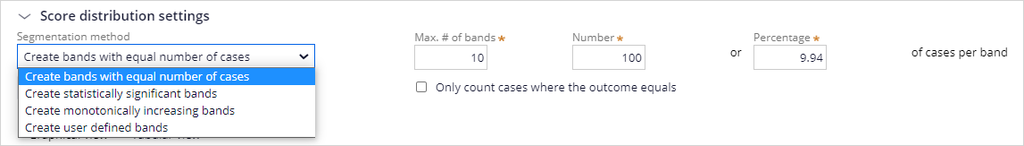
In the 'Score distribution' step, the model scores are segmented based on a method you select. A typical example divides the scores into deciles: 10 classes with an equal number of cases.
The 'Score distribution' settings give several methods for defining these segments.
In the 'Class comparison' step, you can analyze and compare models after the score distribution has been adjusted.
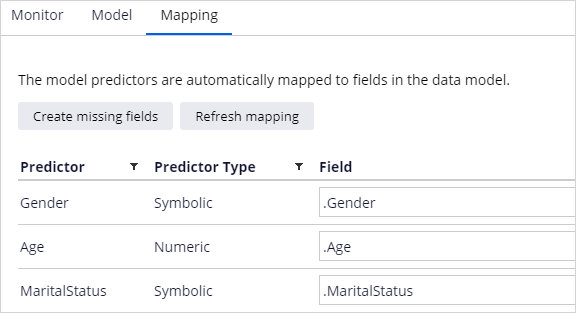
Finally, you select the model that best fits your needs and specify the context in which to save it. The default context where the models are saved is the customer class. Before you can save the model, check the mapping of the predictors to the properties in the customer class. If the properties exist and have a name similar to a predictor field name, they will be mapped automatically. You also have the option to create missing properties, but this should be discussed with the system architect beforehand.
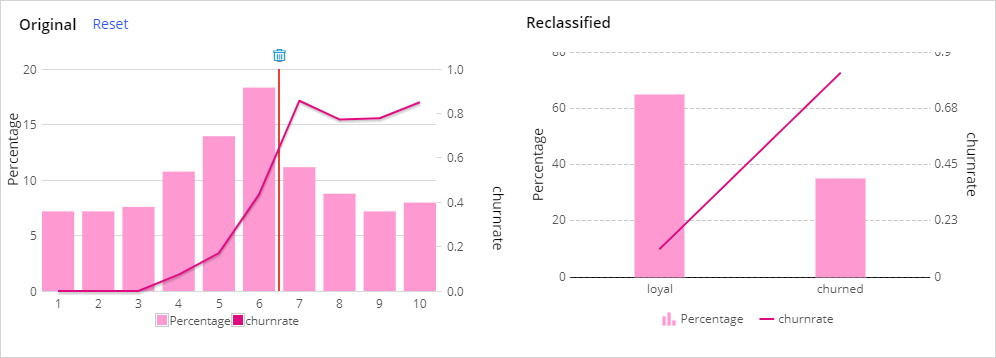
If needed, you can adjust the score distribution segments by clicking on the original score distribution chart. In this example, two segments are appropriate: loyal and churned.
The model can now be saved and is ready for use in a decisioning strategy.
You have reached the end of this demo. What did it show you?
- How to create a predictive model in Prediction Studio using Pega machine learning.
This Topic is available in the following Modules:
If you are having problems with your training, please review the Pega Academy Support FAQs.
Want to help us improve this content?