Reports
Business and process metrics
Business applications often target performance gains in time and efficiency to reduce costs. Poor performance, such as long times to complete tasks, may show a poor application design. You need ways of understanding how complex processes are functioning to learn where bottlenecks are, where there are opportunities to improve response time, and what emerging trends need attention. Data generated by an application can show what is happening, what has happened over time, and whether these results match or differ from your plan.
Application data can be categorized as either business metrics or process metrics.
Business metrics
Business metrics measure the success or failure of business processes, and are based on the data you define for an application. Examples include the number of orders for a certain item, or how many cancellations there are of a certain type of order. Organizations can use these business metrics to make informed decisions about improving business performance.
The following table gives examples of how business metrics can be used in business decisions.
| What is the question? | The data indicates | What is the business decision? |
|---|---|---|
| What is the average profit margin for all automobile sales last year? | The average margin is below the target percentage. | The sales department decides to train its sales staff on promoting cars and options that have the highest margins. |
| What is the number of auto loans made in a month as compared to personal loans for the same period? | The number of personal loans is significantly lower than the number of auto loans. | The goal is to have the numbers approximately equal. The marketing department increases marketing resources for personal loans. |
| What is the number of office desks shipped each week for the past month, and how many are now in inventory? | The number of orders shows an upward trend. | As a result, inventory levels are unacceptably low. The purchasing department decides to restock more desks on a weekly basis. |
Process metrics
Process metrics measure how work is performed, and are based on data automatically collected by Pega Platform™. Examples include the time needed to complete an assignment, how often a path is followed in a flow, or the number of Service Level Agreement (SLA) violations. Process metrics enable business analysts and business managers to discover issues that impact process efficiency.
The following table gives examples of how process metrics can be used in process design decisions.
| What is the question? | The data indicates | What is the process design decision? |
|---|---|---|
| Which open loan application cases exceed the standard three-day service level deadline? | Most of the open cases are for loan amounts greater than USD300,000. | Loan requests that exceed USD300,000 must go through an additional review step, which accounts for the increased processing time. The department manager decides to increase the service level deadline for loans exceeding USD300,000 from 3 to 4 days. |
| What is the average duration of assignments by type and action? | This report identifies which user actions take the longest to complete. | Spend time on improving the efficiency of those assignments taking the most amount of time to complete. |
Check your knowledge with the following interaction:
The role of reports
Reports present users and managers with business and process metrics, based on the data collected during case processing as a set of database records. When designing reports, knowing what information users need and how to use that information is vital.
Stakeholders can provide you with the requirements necessary to create the required reports. For example, stakeholders may want a report that shows the number and dates of resolved cases so managers can check process throughput and determine whether an application meets performance objectives.
Reports can also fetch data to populate user forms with data. For example, stakeholders may need a report that contains a list of customers and their purchase orders, so when a customer calls to file a complaint, the operator can view the customer's previous orders.
Report structure
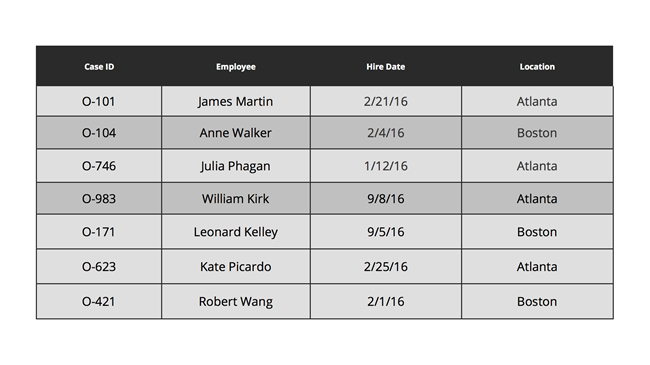
Once you have business requirements, you can configure a report to specify the data from each record that you want to include in the report. The report retrieves the data from a database and returns the results in a table of columns and rows. In the following example, a report returns the case ID, employee name, employee hire date, and office location for onboarding cases.
Columns
Columns define the content of the report. Defining columns in reports is critical to designing reports users need. Each column corresponds to a single data element. The value in the column can be a value field or property such as a case ID, last modified date, or work status. You can format the data value in various ways, such as text, currency, or date. For example, you can format currency properties to include a currency symbol.
You cannot display a data relationship in a column. For instance, if you have an employee data relationship, you can return specific properties but not the entire group; for example, a human resources application processes cases for onboarding newly hired employees. The organization has three office locations. The facilities manager wants a report to monitor new hires. The manager wants to see when the new employees were hired and where each person is assigned. You design a report for the onboarding case type that has five columns. Each column includes a field or property — case ID, new hire name, date of hire, office location, and salary. When the manager generates the report, the report populates a list of rows with values for each column.
You can use calculations in columns to make reports more useful. Calculations, also known as functions, enable you to calculate results derived from data in the database. Pega Platform provides many standard functions you can use without having to create or customize functions. For example, every new hire is evaluated 30, 60, and 90 days from the start date. A manager wants to see the number of days remaining until each evaluation. A function calculates the difference between the new hire date and the evaluation date.
Note: For more information, see the help topic Adding columns to reports.
Filters
By default, report queries return all the records that contain data from all the columns. You may want only to show records that are relevant to your business requirements. For example, your onboarding application collects information on all new hires. The facilities manager at each location needs a report that shows when the new hire needs a workspace. In this case, the user needs new-hire start dates in the coming month for a single location.
A filter defines a test applied to each record to determine whether the record contains data your users need. Filters compare a data value in the record against a defined condition. If the comparison result is true, the report includes the record. If the comparison result is false, the record is omitted.
Assume you work for a company with two locations, Atlanta and Boston. You want to create a report of onboarding cases only for the Atlanta office location. You create a filter in the report that tests whether the office location for each onboarding case is in Atlanta. When you run the report, the filter returns only cases for the Atlanta office. If the office is Boston, that case is excluded.

In a filtering condition, the comparison can be an explicit value or the value of a property or field. For instance, if you want to create a report that returns open orders for a customer, you use a customer property in the filter condition as the comparison to the open orders. The returned records show open orders for each customer. In the previous example, the filter condition uses a comparison that states, "office location equals Atlanta." Therefore, only records where the value of the Location property equals Atlanta are included.
You can also use more complex conditions such as testing values that are greater than a specified threshold, like a date. When you use date or date-time column data in your filter, you can select time periods by using symbolic dates. Symbolic dates let you select time periods or dates without having to build functions. For example, you may want to filter all cases created in the previous month. You can select the Previous Month symbolic option rather than write a function to define the period. The following image shows a partial list of symbolic dates available to users.

Sometimes you may need to create a more complex filter to capture multiple filtering conditions. You can use multiple filters by adding AND/OR conditions. For example, you want to filter out cases with a status of Pending for the manager Anne Walker. You create two filter conditions. One filter states the cases equal a status of Pending. The other filter states that the manager equals Anne Walker. Use an AND condition so that a record must pass both filters to be included in the report.
Note: To learn more about filter conditions, see Editing filter conditions. To learn more about the Report Editor and charts, see Report Editor and Adding or editing charts in the Report Editor.
Check your knowledge with the following interaction:
This Topic is available in the following Module:
If you are having problems with your training, please review the Pega Academy Support FAQs.
Want to help us improve this content?