Decision strategy execution
Introduction
Using Pega Decision Management, you do not need to be an expert in programming, math or data science to design and execute sophisticated decision strategies that engage your customers throughout the customer journey. With its highly intuitive graphical canvas, Pega Decision Management enables you to easily embed Pega or third-party predictive models into your decision strategies. The result is customer-centric interactions that improve the customer experience while increasing customer value, retention and response rates.
Video
Transcript
This demo explains what’s going on inside each component when a Decision Strategy is executed.
For example, what happens "under the covers" when a Filter component is executed, and how does it interact with the components around it?
In the interest of keeping it simple, this example is limited to four actions. In reality, decision strategies will involve many more actions than that.
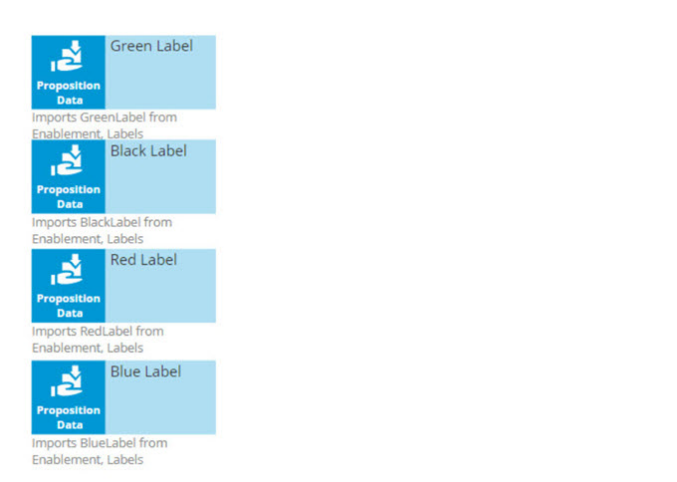
Here are our four actions: Green Label, Black Label, Red Label, and ‘Blue Label’; they are represented by a Data Import or, more specifically, a Proposition Data component.
In this example, the Proposition Data components import three data properties for each action: Name, BaseCost, and LetterCount.
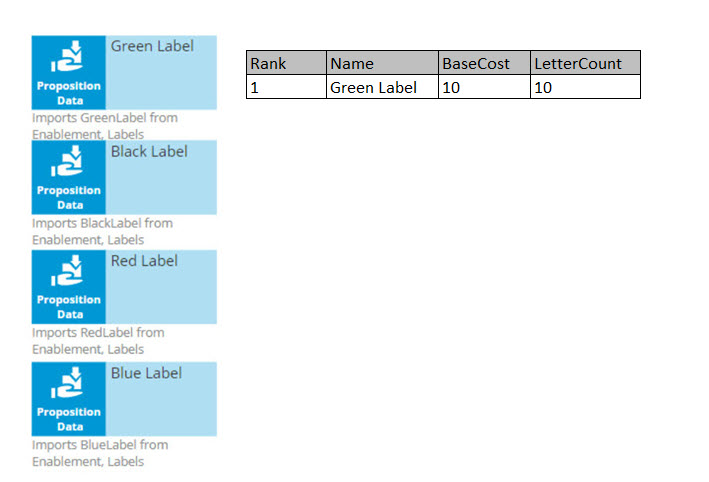
The first action’s Name is Green Label, its BaseCost is 10, and its LetterCount is 10.
Likewise, the other actions have a Name, BaseCost and LetterCount.
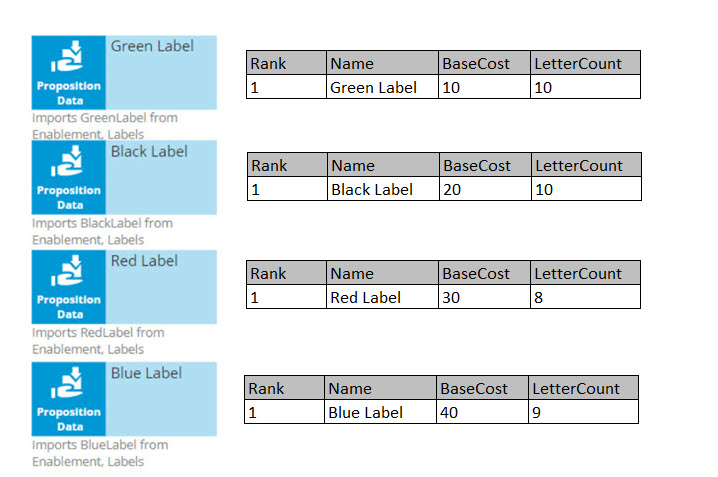
One property is automatically populated for you; this is the Rank. We will come back to this later, but notice that, as separate components, each action has a Rank of 1.
On the strategy canvas, components are connected by drawing arrows from component to component. So, what do these arrows mean exactly?
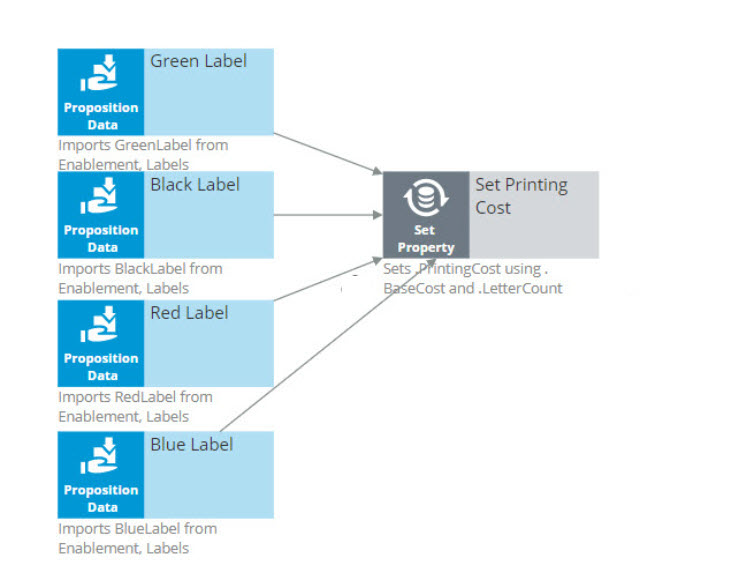
Well, when you draw an arrow, what happens is that, at runtime, all information in the component you’re drawing the arrow from is available as a data source to the component you’re drawing the arrow to.
So now, the Name, BaseCost, and LetterCount for all of the actions are available in a single Set Property component.
The only data element that changes is the row number, or as we call it in the strategies, the Rank. In each decision component, the Rank value is automatically computed.
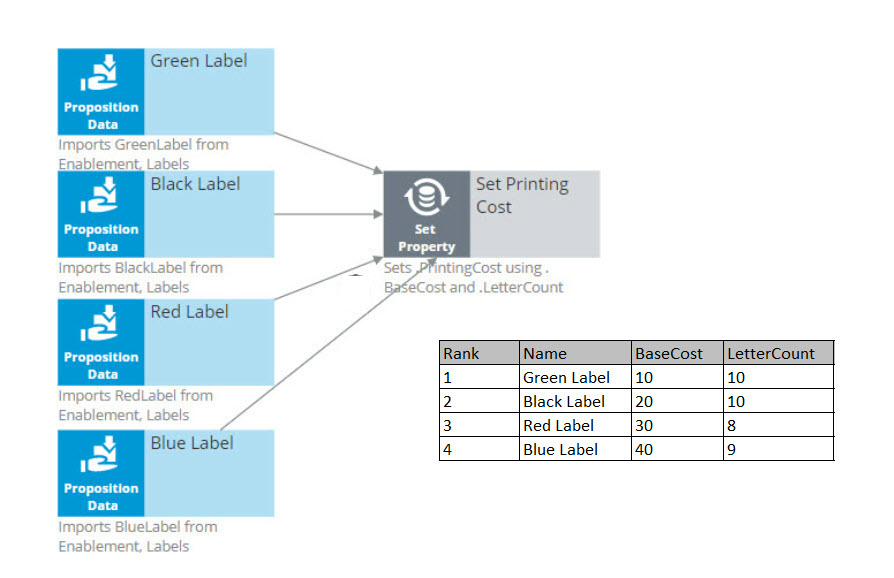
In the Set Property component, the Rank is determined by the order in which the actions are received by the component.
As a result, in this instance, the Green Label action has a Rank of 1, Black has a Rank of 2, Red has a Rank of 3, and Blue has a Rank of 4.
Ultimately, you want to select the best Label action. That is the Label with the lowest printing cost.
The printing cost of a Label is the sum of the BaseCost and a variable cost based on the LetterCount.
You configure the Set Property component to compute the printing cost of each Label action.
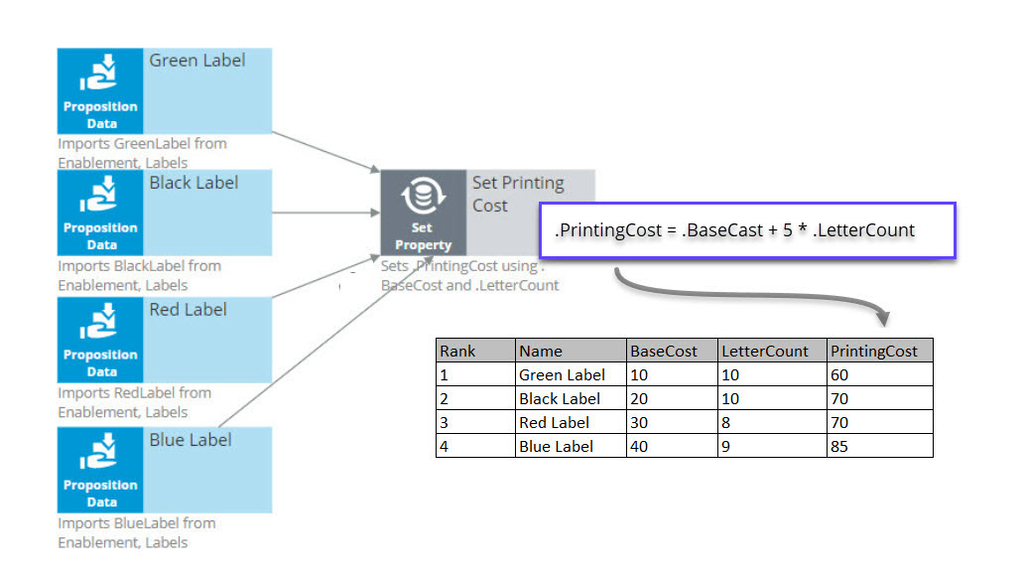
Because we are combining the data in our four Proposition Data components into one Set Property component, we only need to add one PrintingCost property to the new component, and it automatically computes the printing cost for all four actions.
For the Green Label action, PrintingCost equals a BaseCost of 10 plus 5 times the LetterCount of 10 which equals 60.
Similarly, the PrintingCost for the Black and Red Label actions is 70, and for the Blue Label action is 85.
Now, let’s say the business rule is to select only Label actions with a printing cost lower than the average printing cost of all labels. For this requirement, we use a Group By/Filter component combination.
A Group By component offers essential aggregation capabilities, like Sum and Count, that are used in many decision strategies. We will use it to calculate the average printing cost.
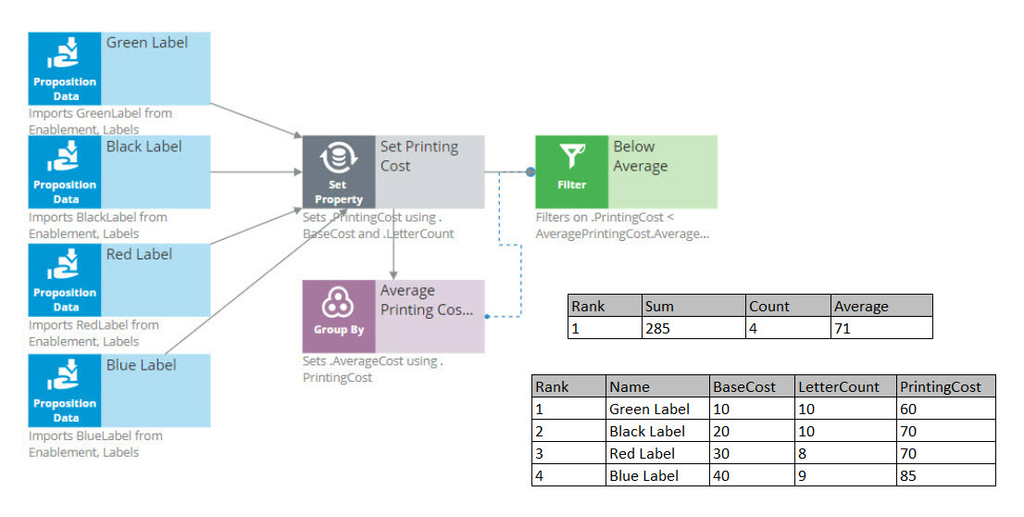
Again, we have our set of actions, each with their own specific PrintingCost value. The Group By component combines all actions into one row. How does that work?
Well, it sums the PrintingCost values for all the actions, it counts the actions, and it calculates the average printing cost by dividing the summed printing cost by the count.
In this example, the sum of the PrintingCost values is 285, and the count of the actions is 4, so the average printing cost is 71.
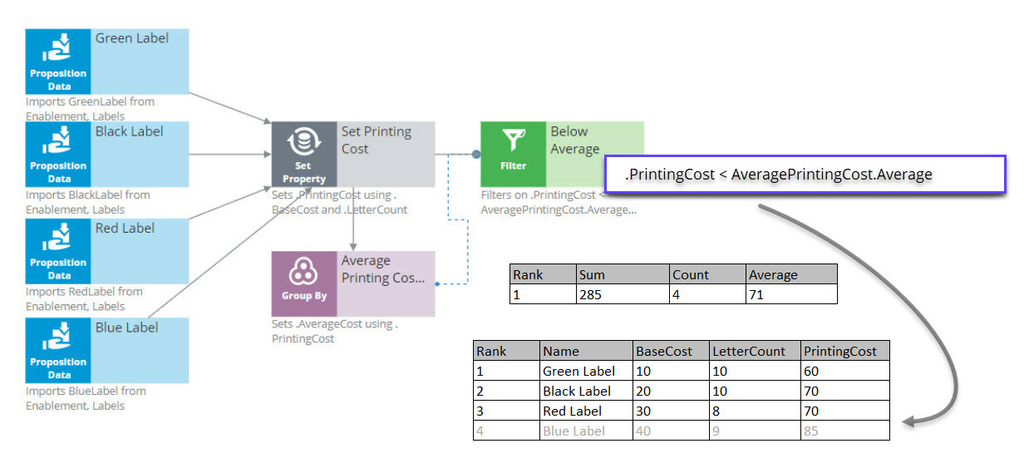
Now that you have calculated the average printing price using a Group By component, configure the Filter component to filter out actions that have a printing cost lower than this average.
So far in this strategy, we’ve seen only the solid line arrows, which copy information from one component to another. But now we also see a dotted line arrow.
This tells us that a component refers to information in another component.
Here, the Filter component is referencing the average printing cost that exists inside the Aggregation component. This is an important capability to understand.
The Filter component filters out actions when the printing cost for that action is equal to or above the average printing cost.
First, via the solid arrow, the filter looks at the actions sourced from the Set Property component.
Then, it applies the filter condition, which references the average printing cost in the Group By component via the dotted arrow.
The Filter Condition in the Filter component is the Expression: dot PrintingCost is smaller than AveragePrintingCost dot AverageCost.
By using this ComponentName dot Property construct, any decision component can be referenced by any other component by name.
Important to note that the Filter component lets actions through when the condition expression evaluates to true and filters out actions when the condition expression is not met.
When you refer to a component, you always refer to the first element in the component, the one with Rank 1.
In this case, you are referring to the one and only row in the Group By component, which naturally has Rank 1.
The Rank 1 average equals 71 in the Group By component. This means that the filter will allow Label actions through that have a printing cost lower than 71.
By this standard, the printing cost of the Blue Label action is too high, so it is filtered out. The printing cost of the other Label actions are below 71, so they survive.
The result is that the table contains three surviving actions: Green Label with Rank 1, Black Label with Rank 2, and Red Label with Rank 3.
The next component is a Decision Table. A Decision Table in Pega is an artifact that can be used to implement business requirements in table format.
In a Decision Table, the business rules are represented by a set of conditions and a set of Return values.
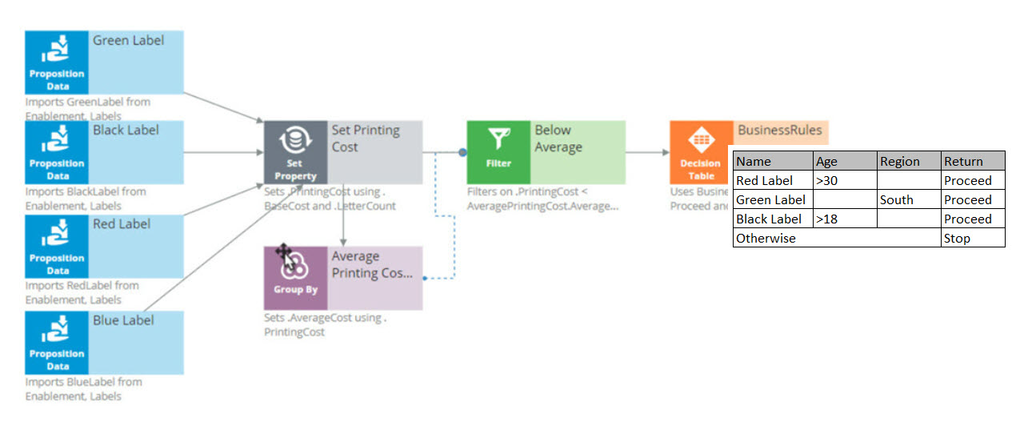
The Decision Table receives information about the remaining actions via the solid arrow from the Filter component.
The business criteria say that the Red Label action can be offered if the customer’s age is over 30 and they are from any region. If these criteria are met, the Return value is Proceed.
The Decision Table also says that the Green Label action can be offered to anyone in the Southern region. So, if the Region value is South, the Return value for Green is Proceed.
The Black Label action can be offered to anyone over the age of 18.
But in all other cases, or, Otherwise, no Label action meets the criteria, and the Return value is Stop.
As an example, consider a customer with Age 27 and Region South.
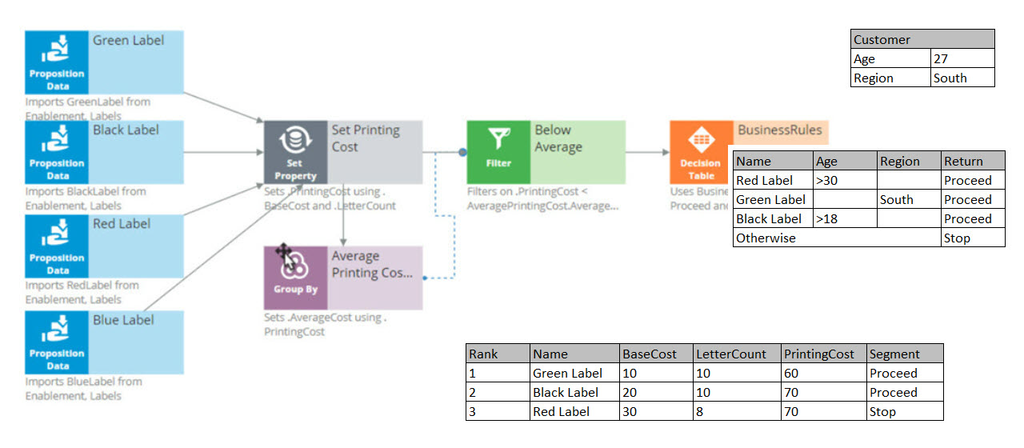
Now, the Decision Table applies the business criteria for each action against the customer information and returns a value. The value returned by a Decision Table is also called a Segment.
The Decision Table checks the Green Label action with Rank 1 first, and in this case, it can proceed because the customer’s Region is South.
Next, it looks at the Black action and sees that the criteria for Black is that the customer’s age is greater than 18. This customer is 27.
Black doesn’t care about the Region, so the Segment value for the Black action is Proceed.
Finally, it looks at the Red action, and the Age criteria don’t match up, so the Segment value for Red is Stop.
The result of the component is that you get a new segmentation column that flags which of the actions comply with the business rules.
You’re now going to filter out the actions that do not match the business rules. This happens in the Segment Proceed filter component.
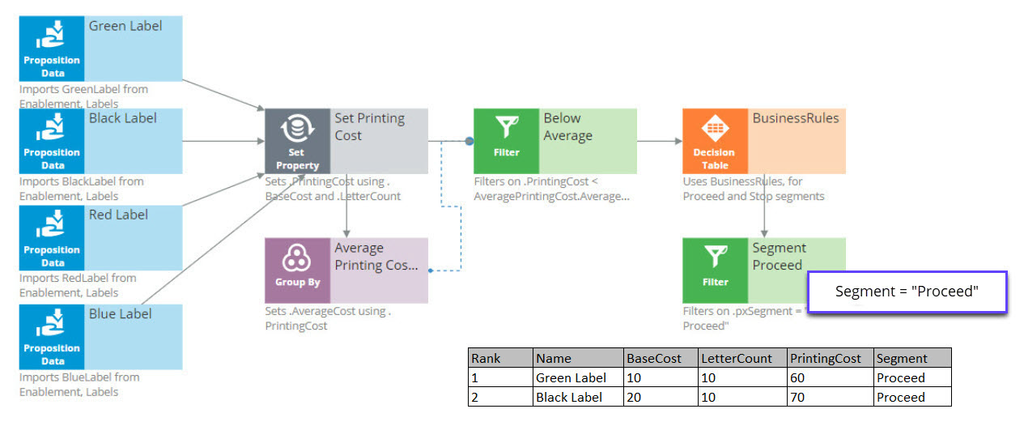
Again, via the solid arrow, the strategy copies the data over from the Decision Table component into the Filter component.
Now each action has a Rank, Name, BaseCost, LetterCount, PrintingCost, and Segment. The filter condition is applied to this data.
The filter condition says: allow this action through if the Segment value equals Proceed.
What this Filter component now does is go through the list of actions to find the actions with value Proceed in their Segment property.
First is the Green Label. Green is allowed through, which means its properties will be available in the new component.
Then the Black Label. It is also allowed through because it also has Proceed in its Segment property.
But the Red Label action is not allowed through, because Red has Stop in its Segment property. Therefore, Red is not part of the output.
The strategy so far has selected two of our original actions, Green and Black.
Now, in the Adaptive Model component, you will use predictive analytics to determine the propensity of each of the remaining actions.
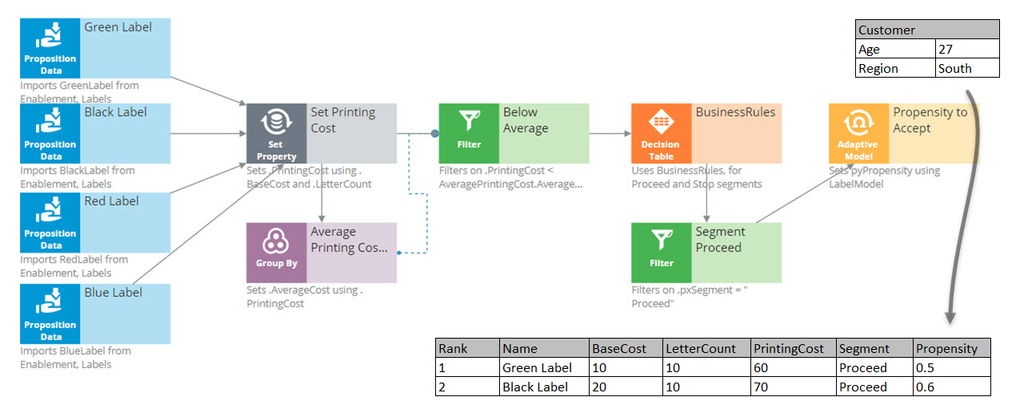
Propensity is the probability that a customer will accept an action, or their likelihood of interest in it.
In order to calculate the propensity, we use an Adaptive Model component. The referenced model is configured to monitor customer characteristics such as Age and Region.
In this case, our test customer has an Age of 27 and is from the South Region.
Again, just to keep it simple, we are using a model that makes predictions based on only this information. In reality, models will take into account many more properties.
The Adaptive Model determines the propensity.
First, we supply the action and the customer profile to the Adaptive Model, and the model says: "Oh, it’s the Green Label action; we have some evidence that young people like the Green Label action, but people from the South don’t like it."
Combining both factors, we get an overall propensity of 0.5 for the Green Label action.
For the Black Label action, the likelihood turns out to be 0.6.
After consulting the Adaptive Model, the Propensity to Accept component sets the Propensity property value for each action.
Remember, the propensity is always a number between zero and 1.
It shows something along the lines of, half of the customers that are like this customer accepted the Green Label action in the past, and 3 out of 5 customers like this customer accepted the Black action last month.
The next component in our chain, called Best Label, is the Prioritize component. This component determines the priority of each action and ranks them. Let’s see how this works.
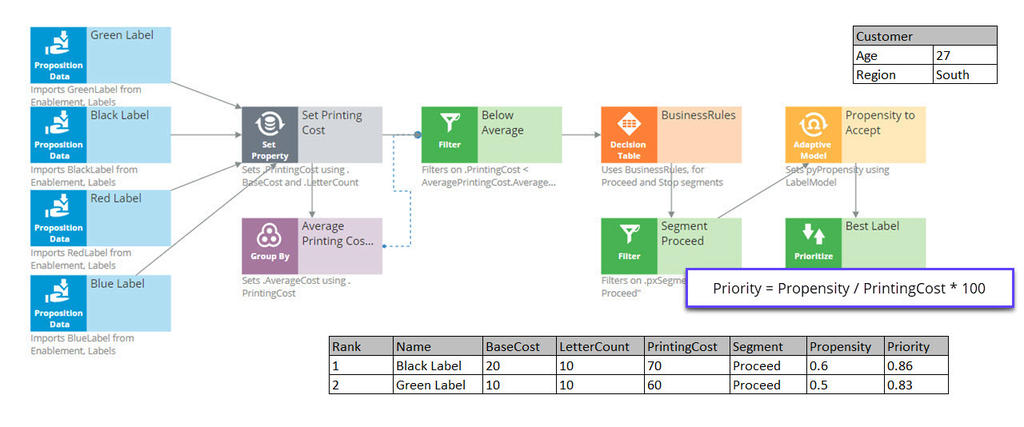
A key element of this component is the priority Expression, which calculates a priority value for each action. According to this Expression, the higher the value, the higher the priority and rank.
In this case, the priority calculation weighs likelihood of acceptance in its equation: Propensity divided by PrintingCost times 100.
When performing this calculation on the Black Label action, we can see that it has a PrintingCost of 70 and a Propensity of 0.6, therefore its Priority is 0.86.
The Green Label action has a lower PrintingCost and a lower Propensity, resulting in a Priority of 0.83.
Because 0.86 is higher than 0.83, the Black Label action is now ranked number one.
So, even though the printing cost of the Black Label action is higher than that of the Green Label action, the Black Label action still comes out on top.
In this case, the Priority component reversed the Ranks of the two actions. Black is now the primary action and Green is the secondary action.
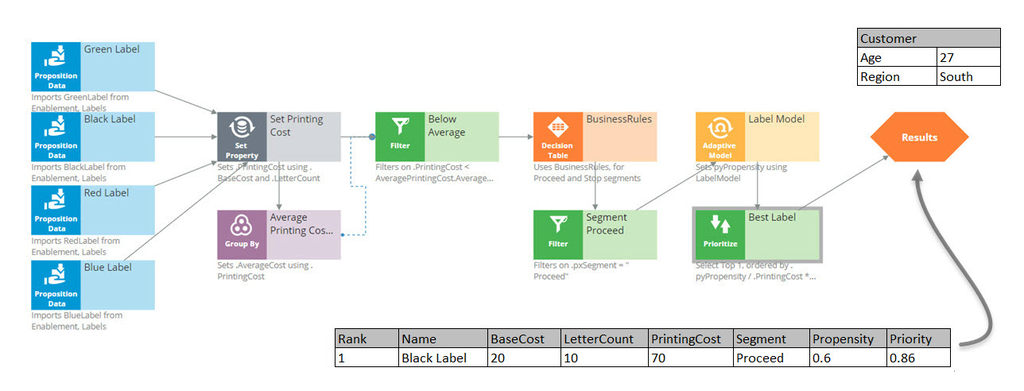
The same Prioritization component is also configured to output only the top action.
Therefore, it filters out the Green action altogether, and at the end of our strategy chain, the Black Label is left as our best action.
This Topic is available in the following Modules:
If you are having problems with your training, please review the Pega Academy Support FAQs.
Want to help us improve this content?