Benutzerdefinierte Geschäftsberichte erstellen
4 Aufgaben
15 Min.
Anfänger
Berichterstellung
Deutsch
Szenario
Einige Beteiligte möchten gern wissen, wie viele Cases im letzten Monat angefordert wurden. Sie wurden gebeten, einen Bericht zu erstellen, um den Status der Unterstützungs-Anfragen in den letzten 30 Tagen zu verfolgen. Legen Sie eine Berichtskategorie „Assistent request cases“ für solche Anfragen an. Erstellen Sie dann eine Berichtsdefinition in der Kategorie „Assistance request“, die die Anzahl und den Status der in den letzten 30 Tagen übermittelten Anfragen anzeigt.
Hinweis: Bevor Sie beginnen, generieren Sie 10–15 Case-Instanzen mit unterschiedlichen Case-Status.
In der folgenden Tabelle finden Sie die Anmeldedaten, die Sie zur Durchführung der Challenge benötigen.
| Rolle | Benutzername | Kennwort |
|---|---|---|
| Application Developer | author@gogoroad | pega123! |
Challenge-Schritte
Genaue Übungsschritte
1 Create a public category for report definitions
- In the Case Manager portal, click Reports to open the Report Browser.
- In the Report Browser, from the Actions menu, click Manage Categories.
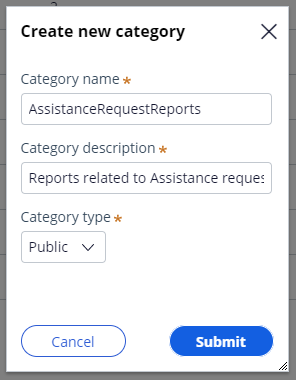
- Click New category to display the Create new category dialog box.
- In the Create new category dialog box, in the Category name field, enter AssistanceRequestReports to name the report category.
- In the Category description field, enter Reports related to Assistance request cases to describe the purpose of the category.
- Confirm that the Category type is set to Public.
- Click Submit to dismiss the dialog box and create the report category.
2 Create a report to display the number and status of requests submitted in the past 30 days
- Click Back to reports to return to the Report Browser.
- In the Report Browser, click New report to display the Create new report dialog box.
- In the Create new report dialog box, from the Case type drop-down, select Assistance Request to display only Assistance request cases in the report results.
- From the Report type drop-down, select Summary or Chart to create a summary report.
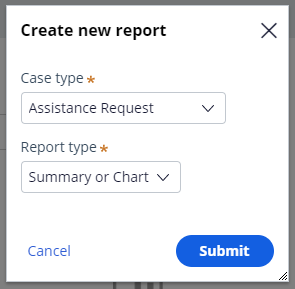
- Click Submit to create the report and display the Report Editor.
- In the Data Explorer pane, click the Label field.
- Drag the Label field into the columns in the Report Editor by positioning the pointer to the left of the Entered on column to add the Label column as the first column in the report.
- In the Filter section of the Report Editor, click Created in Last 7 Days to open the Edit filter window.
- In the Edit filter window, click Select values to display the Select values dialog box to select the time period used in the filter.
- In the Select values dialog box, click Last 30 Days to change the comparison in the report filter.
- Click Submit to complete the configuration of the filter and return to the Edit filter window.
- In the Edit filter window, in the Filter Caption field, enter Created In Last 30 Days to provide a descriptive label for the filter.
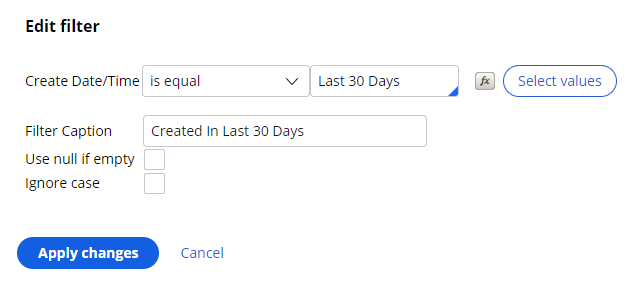
- Click Apply changes to complete the configuration of the filter and return to the Report Editor.
- To the right of the Unresolved Case link, click the X icon to remove the filter from the report.
3 Add a clustered column chart to the report
- Click Add chart to display a window to create a chart for the report.
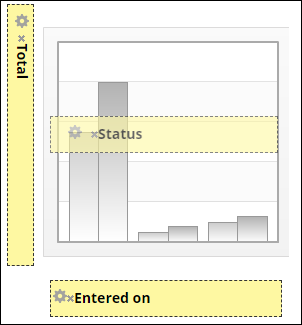
- In the window, click the Column icon and select Clustered to create a clustered column chart.

- From the Available columns list, click Total and drag the pointer into the Drop Aggregate column here drop zone to add the column to the Y-Axis of the chart.
- From the Available columns list, click Entered on and drag the cursor into the Drop Group By column here drop zone to add the column to the X-Axis of the chart.
- From the Available columns list, click Status and drag the cursor into the Drop Any column here drop zone to add the column to the chart.
- Click Apply changes to complete the configuration of the chart and return to the Report Editor. The Report Editor displays a preview of the report.
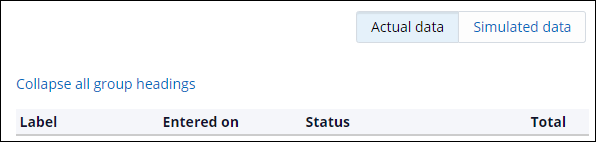
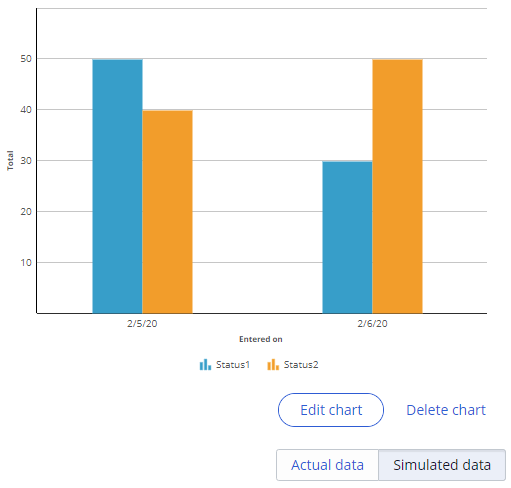 Tipp: The Report Editor provides a preview of the report using actual case data. If you have not created any cases, click the Simulated data switch to display simulated data in the report preview.
 - Click Done editing to complete the configuration of the report and display the Save report as dialog box.
- In the Save report as dialog box, in the Title field, enter Number and status of requests submitted in the past 30 days.
- In the Description field, enter Reports on the number and status of requests submitted in the past 30 days in a summary report with a chart to describe the report for users.
- From the Category drop-down, select Reports related to Assistance request cases to assign the report to the public category you created.
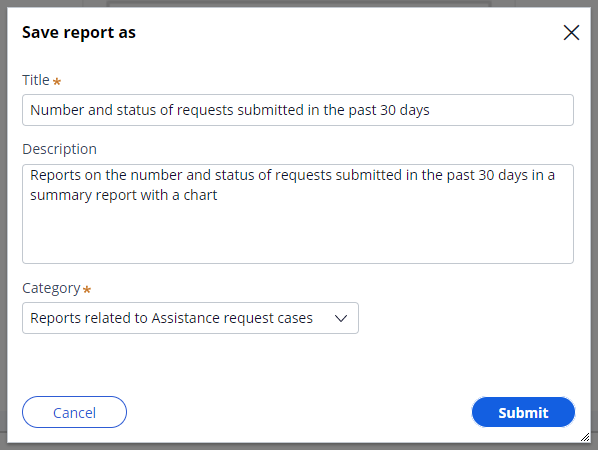
- Click Submit to complete the configuration of the report and view the report results.
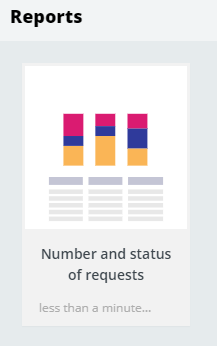
- In the upper-right corner of the report, click the X icon to close the report and return to the Report Browser. The report is displayed as a tile in the Report Browser.
4 Verify your work
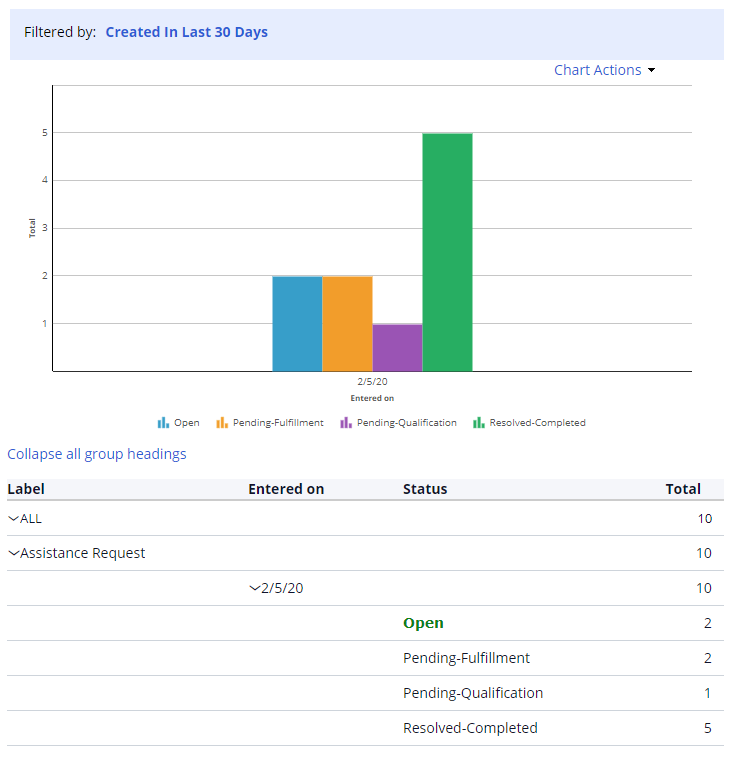
- In the Case Manager portal, in the Report Browser, click the Number and status of requests submitted in the past 30 days tile to open the report. The report is displayed with results similar to the following example.
- In the upper-right corner of the report, click the X icon to close the report and return to the Report Browser.
In der folgenden Mission verfügbar:
Wenn Probleme mit den Lerninhalten auftreten, lesen Sie bitte die Pega Academy Support FAQs.
Möchten Sie uns dabei helfen, diesen Inhalt zu verbessern?