カスタム ビジネス レポートの作成
4 タスク
15 分
初級
レポーティング
日本語
シナリオ
利害関係者が、前月にリクエストされたケース数を知りたいと考えています。 あなたは、過去30日間のサポートリクエストのステータスを追跡するレポートを定義するように依頼されました。 サポート リクエスト ケースのレポートカテゴリーを作成し、次に過去30日間に送信されたリクエストの数とステータスを表示するレポートを表示するレポート ディフィニッションをサポート リクエスト カテゴリーに作成します。
補足: 作業を開始する前に、さまざまなケースのステータスのケースインスタンスを10~15件生成します。
以下の表は、チャレンジに必要なログイン情報をまとめたものです。
| ロール | ユーザー名 | パスワード |
|---|---|---|
| アプリケーションデベロッパー | author@gogoroad | pega123! |
チャレンジ ウォークスルー
詳細なタスク
1 Create a public category for report definitions
- In the Case Manager portal, click Reports to open the Report Browser.
- In the Report Browser, from the Actions menu, click Manage Categories.
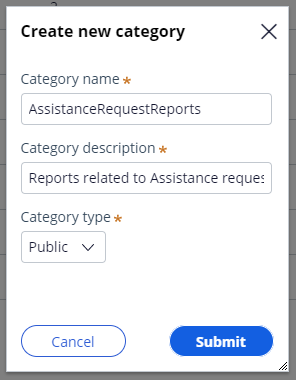
- Click New category to display the Create new category dialog box.
- In the Create new category dialog box, in the Category name field, enter AssistanceRequestReports to name the report category.
- In the Category description field, enter Reports related to Assistance request cases to describe the purpose of the category.
- Confirm that the Category type is set to Public.
- Click Submit to dismiss the dialog box and create the report category.
2 Create a report to display the number and status of requests submitted in the past 30 days
- Click Back to reports to return to the Report Browser.
- In the Report Browser, click New report to display the Create new report dialog box.
- In the Create new report dialog box, from the Case type drop-down, select Assistance Request to display only Assistance request cases in the report results.
- From the Report type drop-down, select Summary or Chart to create a summary report.
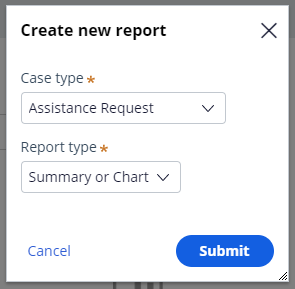
- Click Submit to create the report and display the Report Editor.
- In the Data Explorer pane, click the Label field.
- Drag the Label field into the columns in the Report Editor by positioning the pointer to the left of the Entered on column to add the Label column as the first column in the report.
- In the Filter section of the Report Editor, click Created in Last 7 Days to open the Edit filter window.
- In the Edit filter window, click Select values to display the Select values dialog box to select the time period used in the filter.
- In the Select values dialog box, click Last 30 Days to change the comparison in the report filter.
- Click Submit to complete the configuration of the filter and return to the Edit filter window.
- In the Edit filter window, in the Filter Caption field, enter Created In Last 30 Days to provide a descriptive label for the filter.
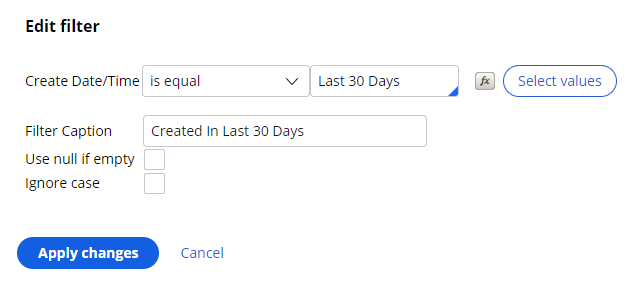
- Click Apply changes to complete the configuration of the filter and return to the Report Editor.
- To the right of the Unresolved Case link, click the X icon to remove the filter from the report.
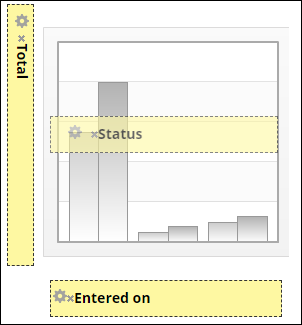
3 積み上げ縦棒グラフをレポートに追加する
- 「Add chart」をクリックして、レポートのグラフを作成するためのウィンドウを表示します。
- ウィンドウで、列のアイコンをクリックして「Clustered」を選択し、積み上げ縦棒グラフを作成します。

- Available columnsリストから「Total」をクリックし、ポインターをDrop Aggregate column hereドロップゾーンにドラッグして、その列をグラフのY軸に追加します。
- Available columnsリストから「Entered on」をクリックし、カーソルを「Drop Group By column here」ドロップゾーンにドラッグして、その列をグラフのX軸に追加します。
- Available columnsリストから「Status」をクリックし、カーソルを「Drop Any column here」ドロップゾーンにドラッグして、その列をグラフに追加します。
- 「Apply changes」をクリックしてグラフの設定を完了し、レポートエディタに戻ります。 レポートのプレビューがReport Editorに表示されます。
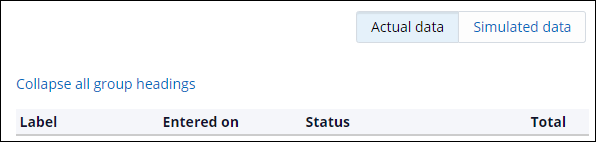
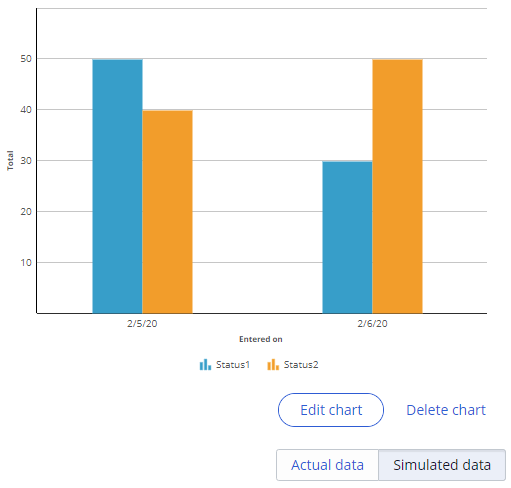 ヒント: レポートエディタに、実際のケースデータを使用したレポートのプレビューが表示されます。 ケースを作成していない場合は、「Simulated data」スイッチをクリックして、レポートプレビューにシミュレーションデータを表示します。
 - 「Done Editing」をクリックしてレポートの設定を完了し、Save report asダイアログボックスを表示します。
- Save report asダイアログボックスの「Title」フィールドに、「Number and status of requests submitted in the past 30 days」と入力します。
- 「Description」フィールドに、「Reports on the number and status of requests submitted in the past 30 days in a summary report with a chart」と入力し、レポートの概要をユーザーに示します。
- 「Category」ドロップダウンから、「Reports related to Assistance request cases」を選択して、作成したパブリックカテゴリーにレポートを割り当てます。
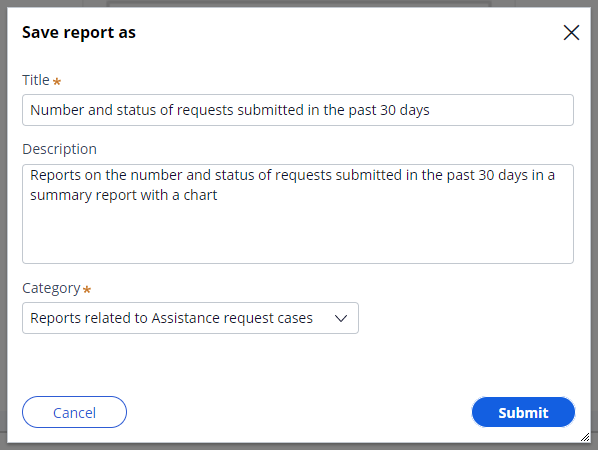
- 「Submit」をクリックしてレポートの設定を完了し、レポートの結果を表示します。
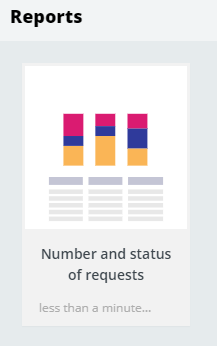
- レポートの右上で、「X」アイコンをクリックしてレポートを閉じ、レポートブラウザに戻ります。 レポートは、レポートブラウザにタイルとして表示されます。
4 作業の確認
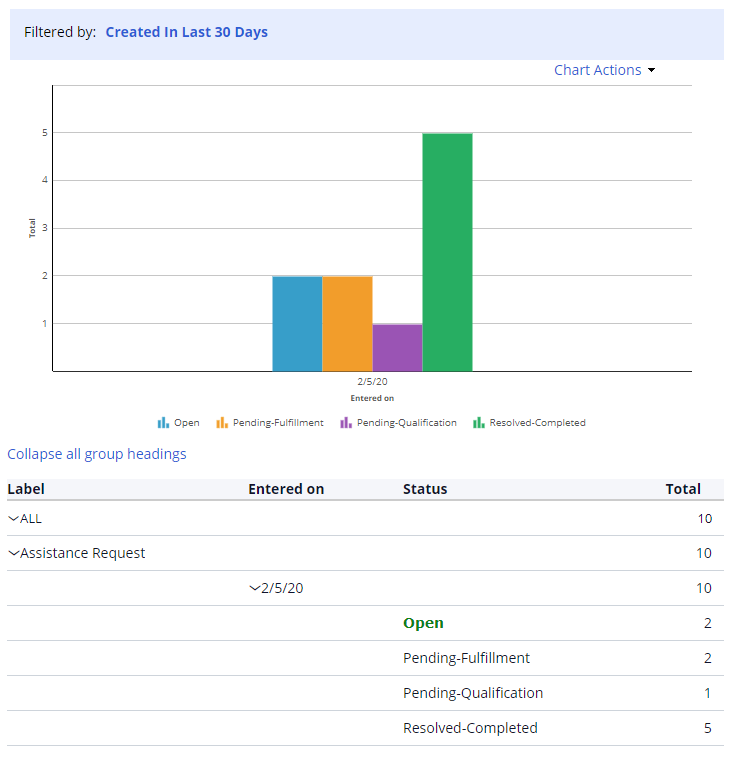
- Case Managerポータルのレポートブラウザで、「Number and status of requests submitted in the past 30 days」タイルをクリックしてレポートを開きます。 以下の例のような結果のレポートが表示されます。
- レポートの右上で、「X」アイコンをクリックしてレポートを閉じ、レポートブラウザに戻ります。
このモジュールは、下記のミッションにも含まれています。
トレーニングを実施中に問題が発生した場合は、Pega Academy Support FAQsをご確認ください。