
Configuring a dashboard
Archived
2 Tasks
30 mins
Beginner
User Experience
Reporting
English
Scenario
During the processing of Assistance Request cases, a customer service representative (CSR) may need to request a credit on the behalf of the customer. Requests for credits are processed and authorized by a manager using a second, legacy system. An integration to the system for credit requests is scheduled for a future release. To ensure the prompt processing of credit requests, stakeholders want to display Pulse notifications on the dashboard so that CSRs can notify managers when a case requires a credit to be issued to the customer.
In addition, stakeholders want to track the user performance on Assistance Request cases on the dashboard using the Average duration per flow task report.
The following table provides the credentials you need to complete the challenge.
| Role | User name | Password |
|---|---|---|
| Application Developer | author@gogoroad | pega123! |
| Customer Service Representative | csr@gogoroad | pega123! |
| Manager | manager@gogoroad | pega123! |
Note: Your practice environment may support the completion of multiple challenges. As a result, the configuration shown in the challenge walkthrough may not match your environment exactly.
Challenge Walkthrough
Detailed Tasks
1 Add the Pulse activity feed and Report widgets to the User portal dashboard
- In the header of App Studio, click Preview.
- In the navigation pane of the application, click Dashboard to open the User portal dashboard.
- In the upper right, click the Gear icon to personalize the dashboard.
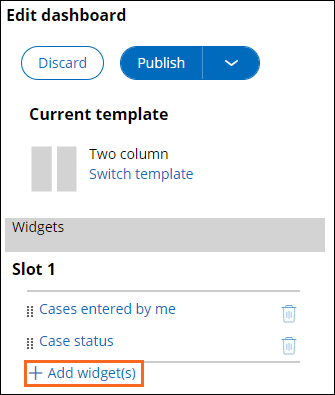
- On the right, in the Edit dashboard pane, under Slot 1, click Add widget(s) to display the Add widgets to slot window.
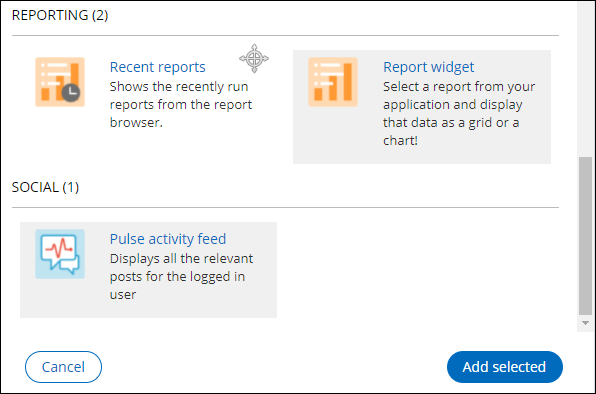
- In the Add widgets to slot window, in the Reporting section, select Report widget.
- In the Social section, select Pulse activity feed, and then click Add selected.
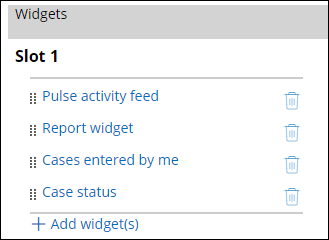
- In the Edit dashboard pane, to the left of the Pulse activity feed widget, click the selection handle and drag the widget to the top position in Slot 1.
- In Slot 1, to the left of the Report widget, click the selection handle and drag the widget below the Pulse activity feed widget.
Note: The Pulse activity feed widget requires no further configuration.
2 Add the Average duration per flow task report to the User portal dashboard
- In the Slot 1 widget list, click Report widget to display the widget configuration section.
- In the Category list, select Analyze Performance.
- In the Report list, select Average duration per flow task.
- In the Width field, confirm that the setting is 100%.
- In the Height field, confirm that the setting is 100%.

- Click Save to complete the widget configuration.
- At the top of the configuration pane, click Publish >Publish to default to finish personalizing the dashboard.
The Pulse activity feed and Report widgets are displayed at the top of the left columns of the dashboard.Note: If you click Publish, rather than Publish >Publish to default, your changes are only visible to the author@gogoroad operator, and not to the csr@gogoroad and manager@gogoroad users.