
Configuring a dashboard
3 Aufgaben
30 Min.
Anfänger
User Experience
Reporting
Englisch
Szenario
Stakeholders have seen growth in the use of the Assistance request application. They want to confirm that, even though cases are increasing, they are still being resolved quickly. The stakeholders have asked to see the number and status of Assistance request cases that have been added over the last 30 days on the User portal's Dashboard landing page.
Hinweis: Your practice environment may support the completion of multiple challenges. As a result, the configuration shown in the challenge walkthrough may not match your environment exactly.
The following table provides the credentials you need to complete the challenge.
| Role | User name | Password |
|---|---|---|
| Application Developer | author@gogoroad | pega123! |
Hinweis: The challenge walkthrough video is coming soon.
Genaue Übungsschritte
1 Add a Report widget to the User portal dashboard
- In the Pega instance for the challenge, enter the following credentials:
- In the User name field, enter author@gogoroad.
- In the Password field, enter pega123!.
- In the header of App Studio, click Preview.
- In the navigation pane of the application, click Dashboard to open the User portal dashboard.
- In the upper right, click the Gear icon to personalize the dashboard.
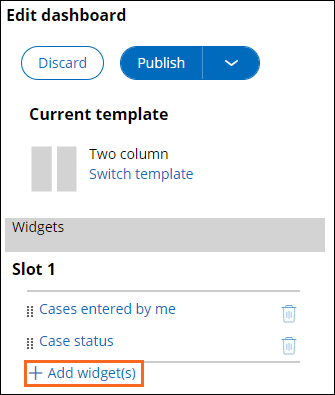
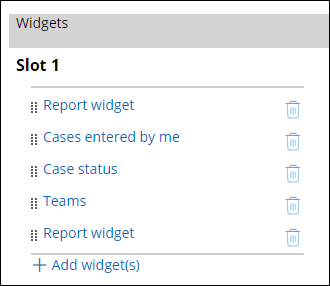
- On the right, in the Edit dashboard pane, under Slot 1, click Add widget(s) to display the Add widgets to slot window.
- In the Add widgets to slot window, in the Reporting section, click Report widget, and then click Add selected.
- In Slot 1, to the left of the Report widget, click the selection handle and drag the widget to the top position in Slot 1.
2 Add the Average duration per flow task report to the User portal dashboard
- In the Slot 1 widget list, click Report widget to display the widget configuration section.
- In the Category list, select Reports related to Assistance request reports.
- In the Report list, select Number and status of requests submitted in the past 30 days.
- In the Width field, confirm that the setting is 100%.
- In the Height field, confirm that the setting is 100%.
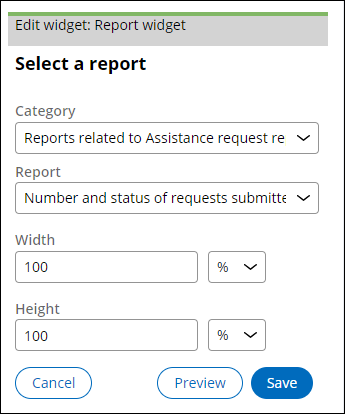
- Click Save to complete the widget configuration.
3 Switch the dashboard template
- Under Current template, click Switch template to display the Select a template window.
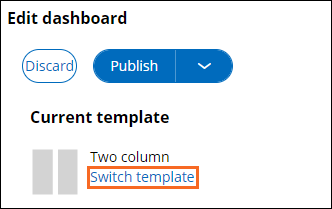
- In the Select a template window, click Full width.
- Confirm that all dashboard widgets are listed under Slot 1.
- At the top of the configuration pane, click Publish >Publish to default to finish personalizing the dashboard.
Hinweis: If you click Publish, rather than Publish > Publish to default, your changes are only visible to the author@gogoroad operator, and not to the csr@gogoroad and manager@gogoroad users.
In dieser Challenge üben Sie, was Sie im folgenden Modul gelernt haben:
Wenn Probleme mit den Lerninhalten auftreten, lesen Sie bitte die Pega Academy Support FAQs.
Möchten Sie uns dabei helfen, diesen Inhalt zu verbessern?